2025 Transportation Outlook
Feb 19, 2025
2025 Transportation Outlook
Q1 2025 Update
In 2024, the freight market challenged traditional expectations of cycle dynamics, highlighting the extended duration of the current downturn.
Now in 2025, macroeconomic forces continue to shape the freight landscape, driving notable volatility in demand, capacity and pricing. This changing landscape pushed companies across the sector to adapt to ongoing economic pressures and shifting market conditions.
In the Q1 2025 Transportation Outlook, we will cover:
- Regulations, trade and tariffs and the impact on the freight market.
- The state of freight capacity and its impact on the market.
- Current trends and forecasts for Truckload Spot and Contract Rates.
- Expectations for other transportation modes including Drayage, Less-Than-Truckload (LTL) and Parcel.
- How macroeconomic indicators like GDP, consumer spending, industrial production and imports are shaping freight demand.
- Strategies to prepare for the upcoming peak season and beyond.
We know not everyone has time to read the entire Outlook, so you can click one of the sections below to get exactly what you’re looking for:
- Key Themes and What to Watch Out For: Tariffs, Trade, De Minimis Exemption, Inflationary Spot Rates
- Freight Shipping Demand Metrics: Cass Freight Index
- Freight Shipping Supply Metrics: Grants and Revocations of Operating Authority
- Truckload Spot and Contract Rate Forecasts: Where is the market going?
- Port to Porch Forecast: Drayage, Less-Than-Truckload and Parcel Insights
- Core Macroeconomic Metrics: GDP, Diesel Fuel, Consumer Spending, Inflation, Interest Rates and Consumer Confidence PCE, Industrial Production, Inventory to Sales and Imports
Key Events and What to Watch
Tariff & Trade Impact under Trump Administration
The new Trump Administration’s focus on revising global trade dynamics led to a series of notable tariffs:
- China: Imposed a 10% tariff on a wide array of goods to pressure renegotiation of trade terms.
- Mexico: a 25% tariff is set to be imposed on March 4, 2025.
- BRICS Nations (Excluding China): There’s no common policy, but extreme tariffs, like the mentioned 100%, would have targeted specific industries.
- European Union: Facing potential tariffs aimed at reducing the trade deficit and promoting domestic production.
A 25% steel and aluminum tariff are scheduled to be implemented on March 12, 2025. Other commodities with increased tariffs under consideration are steel, copper, integrated circuits, medicine and pharmaceuticals, semiconductors and automobiles. Here is a tracker of tariffs.
Exclusion Requests and Approvals: With the widespread tariffs, the United States Trade Representative (USTR) processed over 52,000 exclusion requests, granting about 35%, which translates to around 18,200 approvals. This move was especially pertinent for steel and aluminum imports, crucial to various manufacturing sectors.
More information can be found in the America’s First Trade Policy.
De Minimis Exemption & Shipping
De Minimis continues to be a key focus area in trade and tariff changes. There was an attempt to implement a policy change on de minimis, however, there is a current hold after some logistical issues with the clearance of those packages and USPS having no system in place to collect tariffs. The de minimis exemption allows shipments valued below $800 to enter the US without import taxes and minimal inspections. According to Reuters, over 90% of all packages coming into the US now enter via de minimis and 60% of those come from China.
Large ecommerce companies such as Shein and Temu would be particularly affected, reporting there would be significantly increased customs charges because of the elimination of the de minimis exemption. Consequently, consumers may face higher prices for products purchased from these and other retailers impacted by the De Minimis elimination.
Spot Freight Rates Inflationary
Spot Rates are inflationary, +7.5% YoY in 4Q24, but there was a drop at the beginning of 2025. Other factors to consider as you look at where the market is headed:
- Tender rejection rates, once peaking around 10%, have now stabilized and are expected to rise throughout the year.
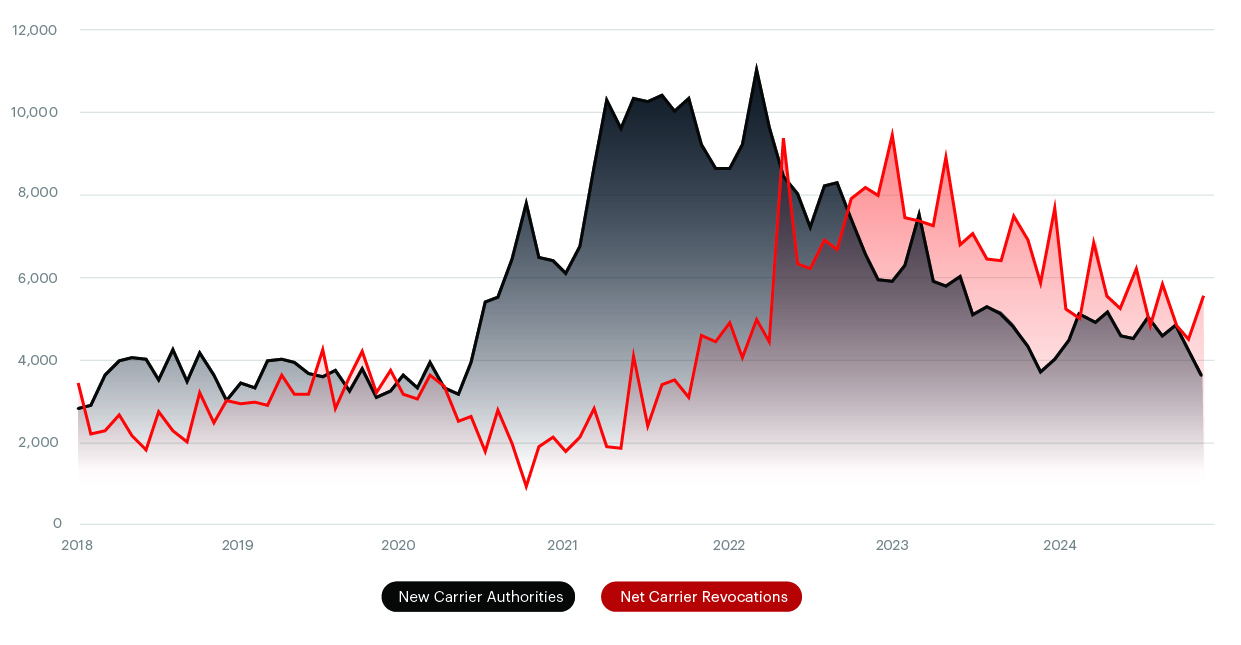
- Capacity is coming out of the market indicated by steady carrier revocations outpacing new authorities.
- Consumer demand remains positive in low single digits from GDP reports.
Overall transportation service costs remain high year-over-year, the impact has been somewhat mitigated by lower fuel and equipment expenses, affecting the overall market dynamics.
Freight Shipping Demand Metrics
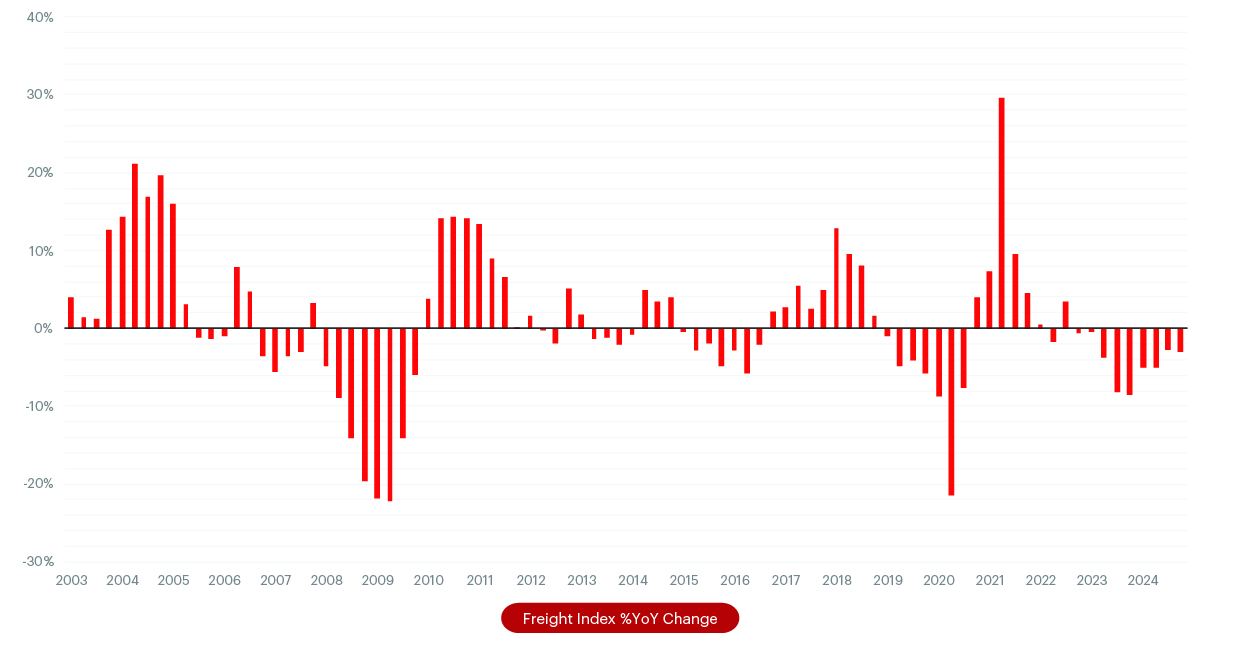
- In January 2025, the American Trucking Associations’ (ATA) advanced seasonally adjusted For-Hire Truck Tonnage Index decreased by 3.5% compared to December 2024, bringing the index to a level of 111.0. This decline follows a 1.2% increase in December 2024. The index fell by 4.7% YoY from January 2024, marking the eleventh consecutive annual decrease. ATA Chief Economist Bob Costello attributed the January downturn to adverse winter weather and significant drops in key freight drivers such as retail sales, housing starts and manufacturing output.
- In January 2025, the Cass Truckload Linehaul Index reported a 0.6% month-over-month (MoM) increase, marking the fifth consecutive monthly rise since a cycle low in August 2024. Notably, the index experienced a 0.8% YoY increase, the first positive YoY change since December 2022. Despite these gains, the index remains 5.2% lower than it was two years ago, reflecting the lingering effects of previous market downturns.
Source: Cass Freight Index
Freight Supply Metrics
Source: Federal Motor Carrier Safety Administration (FMCSA)
More Info:
- In Q4 2024, revocations totaled just over 15,000, the lowest since early 2022. In Q4 2024, December was the highest month of the quarter with 5,565 revocations.
- For the full year of 2024, 67,421 carriers had their operating authority revoked, reflecting a 22% decline compared with 2023, but still 64% higher than pre-pandemic levels.
- The FMCSA’s Clearinghouse-II Rule, implemented in November 2024, is expected to further influence revocation trends by enforcing stricter compliance for drivers with unresolved drug or alcohol violations, potentially leading to additional capacity reductions in the coming months.
- Meanwhile, Class 8 truck orders in January 2025 fell to approximately 25,800 units, a 30% decline from December and a 5% decrease YoY. This downturn is driven by high interest rates, economic uncertainty and new regulatory measures, including the EPA’s Clean Truck standards, are impacting fleet purchasing decisions.
A revocation means the company or carrier no longer holds operating authority; therefore the carrier is no longer permitted to transport cargo across state lines.
Truckload Spot & Contract Rate Forecast
What is the Beon™ Band?
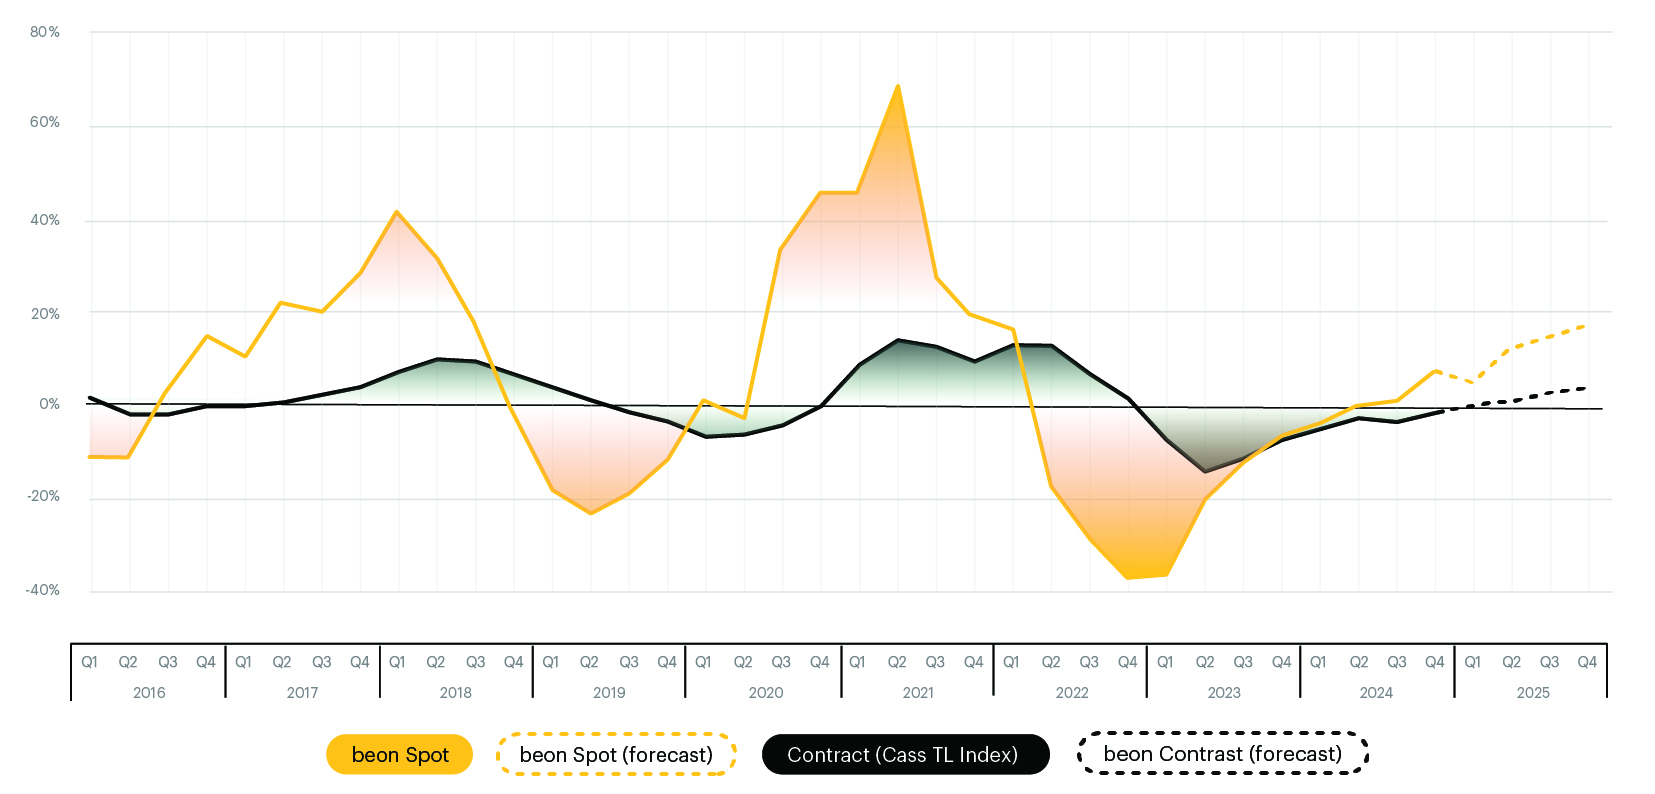
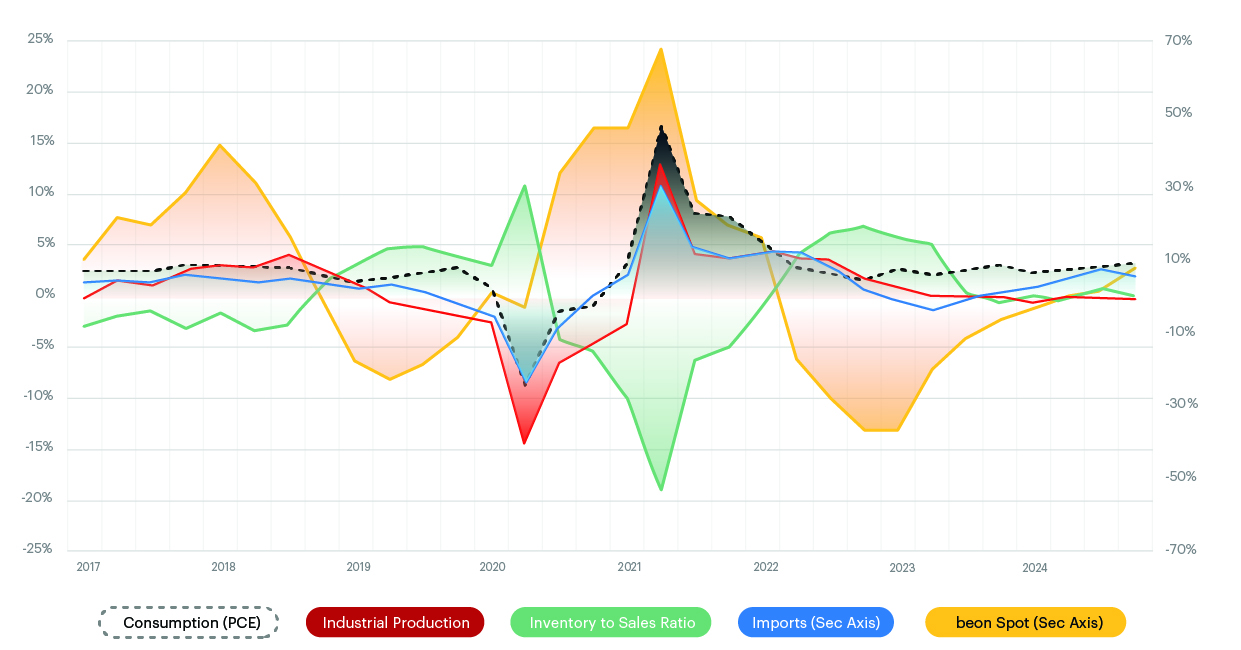
The Beon™ Band rolls up YoY quarterly averages of spot and contract freight data to create projections for future freight cycles. This Band is the outcome of the relationship between freight supply and freight demand, with freight demand being driven by the macroeconomic demand indicators. When we overlay the Beon™ Band with the demand curve in a single chart, we can see demand’s influence on the to-the-truck costs.
Source: Beon Band – Transportation Insight & Nolan Transportation Group
When the Beon™ Band is overlayed with the macroeconomic indicators of freight demand, we can understand how some of these factors impact freight rates and thereby forecast where we see the market going over the next couple of quarters.
Freight Rate Forecast
Spot Freight
- Linehaul spot rates finished inflationary 4Q24 at +7.5% YoY. By 4Q25, we expect linehaul spot rates to remain inflationary, potentially reaching a 17.5% increase YoY. We will see tender rejections continue to increase, but we are unsure if these inflationary rates will trigger a tender rejection waterfall, which would cause a mass flow of freight from the contract market to the spot market.
Contract Freight
- The Cass Truckload Linehaul Index, which measures per-mile truckload linehaul rates, experienced a 0.6% month-over-month increase in January 2025; this marks the first YoY inflationary month of 0.8% in the current cycle. Compared with the prior year, the 4Q24 index declined by 1.3%. We expect the contract rates to increase 4.0% YoY by the end of 2025.
We’ve experienced a host of challenges in the transportation industry over the past couple of years – tariffs, ILA, global conflicts, market oversupply and waning consumer demand, not to mention stubborn inflation. As we settle into 2025, we find ourselves diving further into this supply-driven cycle including an oversupply of trucks. While supply is slowly exiting and demand remains flat, we’re starting to see the first signs of the next cycle’s challenges. But let’s not get too ahead of ourselves – until we start seeing tender rejections hit that double-digit mark, it’ll likely be the same gradual, steady or single digit increases for spot rates that we’ve seen over the past year.
Port to Porch Market Forecast
Drayage Shipping
Tariffs and general trade uncertainty are impacting freight forwarding and drayage shipping across the board. With pending tariff discussions, we should continue to see some changes within the market.
- Import cargo levels at major US container ports are projected to stay high particularly in the first half of the year. Retailers are accelerating their import activities in anticipation of rising tariffs on goods from China due to ongoing trade disputes and to also avoid impacts from possible new tariffs from other countries. (Source: The National Retail Federation NRF, Hackett Associates, Global Port Tracker).
- As tariffs loom, retailers are frontloading imports to avoid higher tariffs, potentially leading to increased demand for warehousing particularly near ports.
- US ports are expected to maintain strong import numbers, though uncertainties remain about the implementation of tariffs and their broader impact on the economy.
- In December, US ports handled 2.14 million Twenty-Foot Equivalent Units (TEU), and the total for 2024 reached 25.5 million TEU, reflecting an increase from the previous year and nearly matching record levels seen in 2021.
- Import projections for 2025:
- January 2025: 2.11 million TEUs (7.8% increase YoY).
- February 2025: 1.96 million TEUs (0.2% increase YoY). Of note, February is typically a slower month due to Lunar New Year.
- March to June 2025: Gradual increases, with March projected at 2.14 million TEUs (11.1% increase YoY), peaking at 2.19 million TEUs in May (5.4% increase YoY).
- Key Dates to Remember:
- March 4, 2025: US will impose a 25% tariff on all aluminum and steel imports across all countries. This will impact key industries as users of steel (autoparts, machinery, military equipment and nuts/bolts) and aluminum (food and beverage products sold in cans, industrial molds, etc.).
Less-Than-Truckload Freight (LTL) Shipping
For LTL contract and spot rates, most rates should remain similar to last year. If there are increases, they should be minor at 5% or less. The main thing for shippers to watch out for is with the NMFTA looking to move more commodities to density-based classification, shippers should seriously consider the timing and benefits of dimensioning systems/technology.
Last year, FedEx Freight, the largest less-than-truckload (LTL) carrier in the US, announced their intention to spin off FedEx Freight from the larger FedEx entity within the next 18 months. This move has sparked discussions in the logistics and transportation industry, with industry experts speculating on the possible implications. This year, we should see how this plays how and the larger impact on the dynamics within the LTL market.
- Key Dates to Remember:
- March 3, 2025: FCDC Public Meeting, which is the final NMFTA meeting when the docket will be approved for any freight class changes. Of the 5,250 items originally in scope, over 3,000 have now been taken out of scope for Docket 2025-1.
- July 19, 2025: NMFTA freight class changes go into effect.
Parcel Shipping
This year, changes in tariffs and charges have led to a significant transformation in the parcel shipping industry, impacting carriers, retailers and consumers. This marks a period of notable evolution in the industry, different from the usual yearly General Rate Increases (GRIs) at the start of the year.
2025 Parcel Rate Changes & Increases
FedEx, UPS and DHL have all implemented a 5.9% base rate increase across all categories, effective between December 23, 2024, and January 18, 2025.
FedEx implemented another fuel surcharge change on February 10th. FedEx Air increases 1.0% and FedEx Ground increased 1.75% based on current fuel prices. UPS made similar changes to these service levels effective December 23, 2024. Currently, UPS’s Air fuel surcharge is 17.75% compared to FedEx’s at 18.00% and UPS’s ground fuel surcharge is 18.00% compared to FedEx’s ground fuel surcharge at 18.25%.
USPS’s Policy Changes on China and Hong Kong Shipments
The US Postal Service (USPS) briefly suspended and then reinstated the acceptance of parcels from China and Hong Kong. This action followed President Trump’s removal of a duty-free exemption for low-value packages, aiming to curb illegal fentanyl shipments. The suspension caused confusion among retailers and shippers, particularly affecting companies like Temu, Shein and Amazon.
Currently, USPS and US Customs and Border Protection are working together to devise an effective mechanism for collecting tariffs on small packages, aiming to streamline the process and ensure compliance in the midst of evolving regulatory changes.
USPS Rate Increases
USPS increased rates for its Priority Mail and Priority Express Mail by 3.2%. These recent changes by USPS were significant to the national carriers’ networks and significant pricing increases were imposed in early January 2025 as a result.
Postmaster General DeJoy Steps Down
Postmaster General Louis DeJoy will step down as head of the US Postal Service only 4 years into his 10 year “Delivering for America” plan to streamline delivery operations. More information to come on how this will impact postal consolidation services. Read more.
UPS Stock Price & Shift Away from Amazon
UPS’s stock experienced a significant decline following the announcement of plans to reduce its business with Amazon by over 50% by the second half of 2026. This strategic shift aims to focus on more profitable customers and improve profit margins. The news led to a 14.1% drop in UPS’s stock price, marking its worst single-day performance in history.
For the full year of 2025, UPS projects consolidated revenue of approximately $89 billion, which is below analysts’ expectations of $94.9 billion.
Additionally, UPS announced plans to insource the final delivery of its SurePost product, effective January 1, 2025. This move is intended to enhance control over delivery volumes and improve service efficiency.
Competitive Landscape of Regional Parcel Carriers
Regional carriers are increasingly challenging the dominance of FedEx and UPS by offering competitive pricing and specialized services. In response to aggressive discounting by FedEx and UPS, regional carriers are mounting a strong competitive response, posing a potential threat to the market share of the major national carriers. This trend indicates a shifting and increasingly competitive environment within the parcel shipping industry.
We’re here to help. If you have any questions or feedback, on TI & NTG’s Transportation Outlook, or want to speak to one of our experts. Fill out this form, and mention “Transportation Outlook” and we will connect you to a member of our team.
Core Macroeconomic Metrics
GDP, Consumer Spending, Inflation & Interest Rates
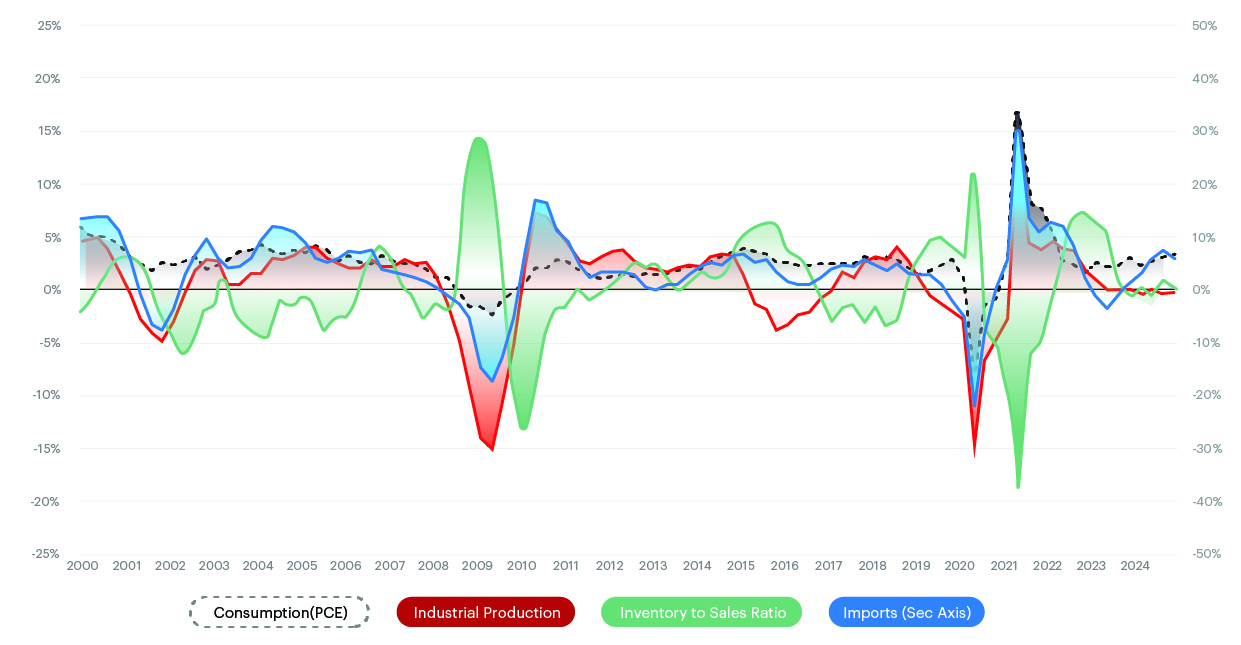
- GDP growth slowed to 2.3% in Q4, down from 3.1% in Q3, with YoY expansion at 2.8%, slightly below 2023’s 2.9%. While weaker investment and exports contributed to the slowdown, consumer spending remained strong, with PCE rising by 0.7% in December 2024.
- Core PCE inflation rose 2.8% YoY, with persistent price pressures in housing and services. Rising labor costs contributed to inflationary stickiness, making businesses cautious about passing on costs to consumers. The Federal Reserve remains cautious on rate cuts, as slowing GDP growth increases the likelihood of easing later in 2025.
Consumer Confidence and Purchasing Power
- In January 2025, the Consumer Price Index (CPI) rose by 0.5%, the largest monthly increase since August 2023, leading to a year-over-year inflation rate of 3.0%. This surge, driven by higher costs in prescription medications and motor vehicle insurance, indicates that consumers are facing elevated prices across various sectors, effectively reducing their purchasing power.
Diesel & Fuel Prices
- As of February 10, 2025, the US average on-highway diesel fuel price was $3.665 per gallon, reflecting a slight increase of $0.005 from the previous week and a decrease of $0.444 compared to the same period last year.
Source: Bureau of Economic Analysis (BEA), Federal Reserve, Census Bureau, Bureau of Labor Statistics
Personal Income & Real PCE
- As of December 2024, the BEA reported that personal income increased by $92.0 billion, or 0.4% MoM, consistent with the previous month’s growth rate. Personal income rose by approximately 5.0% YoY. Disposable personal income (DPI) also saw a 0.4% monthly increase.
- The Personal Consumption Expenditures (PCE) price index increased by 0.3% month-over-month, resulting in a year-over-year rise of 2.6%. The core PCE price index, which excludes food and energy, rose by 0.2% from the previous month and 2.8% compared to December 2023.
Industrial Production & Manufacturing Output
- In January 2025, US industrial production rose 0.5% MoM and 2.0% YoY, driven by a 6.3% surge in aerospace production, though manufacturing output declined 0.1% due to a 5.2% drop in motor vehicle production. Capacity utilization increased slightly to 77.8%, remaining 1.8 percentage points below the long-term average, signaling room for further recovery.
- The US manufacturing sector expanded for the first time in over two years, with the Institute for Supply Management’s (ISM) Manufacturing Purchasing Managers’ Index (PMI) rising to 50.9%, up from December’s 49.2%. This growth was driven by increases in new orders, which reached 55.1%, and production, which climbed to 52.5%. Additionally, the Employment Index improved to 50.3%, indicating growth in manufacturing employment. However, the Prices Index also rose to 54.9%, suggesting that managing price increases will be a significant challenge for the sector in 2025.
Imports & Exports
- In December 2024, US container import volumes reached 2,367,271 TEUs, marking a slight 0.1% decrease from November, but a 12.4% increase compared to December 2023. This brought the total imports for 2024 to 28,196,462 TEUs, reflecting a 13% rise over 2023. Imports from China in December 2024 increased by 1.7% over November, totaling 902,519 TEUs, and were 14.5% higher than December 2023.
Inventory to Sales Ratio
- In December 2024, US business inventories declined 0.2% MoM, marking the first drop in nine months, though they remained 2.0% higher YoY. Business sales rose 0.8% from November and 3.1% YoY, bringing the inventories-to-sales ratio down to 1.35, compared to 1.37 in both November 2024 and December 2023, indicating faster inventory turnover. Wholesale inventories saw a 0.5% monthly decline and a 0.1% YoY decrease.
Thank you for reading TI & NTG’s 2025 Transportation Outlook.
TI & NTG’s Transportation Outlook will be updated in May to reflect new data and macroeconomic releases. If you have questions on the Transportation Outlook, please email us.


