


Q3 2025 Transportation Outlook
Explore the Q3 2025 Transportation Outlook for expert analysis on freight trends, challenges and opportunities to better prepare your business for what’s ahead.


Freight markets no longer follow traditional cycles. Technology, AI and advanced analytics quickly absorb small shifts in supply and demand, muting the impact of incremental changes. Only major shocks such as natural disasters, regulatory shifts or global crises can disrupt today’s data-driven equilibrium.
This comprehensive update brings together expert analysis, proven logistics strategies and timely market intelligence to help you plan with confidence. With our deep expertise, advanced technology and practical insight, we’re here to support your goals and ensure your supply chain stays efficient, resilient and prepared.
- Key Themes and What to Watch Out For
- Freight Shipping Demand Metrics
- Freight Shipping Supply Metrics
- Truckload Spot and Contract Rate Forecasts
- Port to Porch Forecast
- Core Macroeconomic Metrics
Key Events and What to Watch
1. Capacity is continuing to leave the market indicated by net revocations, but has yet to drive a meaningful and non-seasonal increase in freight rates.
2. Consumer demand outlook remains bleak even as inflation seems to be under control and stock markets are at record highs.
3. Warehouses/inventories are said to be full relative to sales; resulting in slowed imports normalized for tariff spikes.
4. The April pause on reciprocal tariffs with China was extended for another 90 days into November. Uncertainty around the trade relationship between the two nations earlier in the year led to significant front-loading of imports by U.S. firms earlier in the year, subsequently reducing the intensity of the traditional Q4 peak season.
5. Newly implemented reciprocal tariffs are expected to pressure supply chains, especially for high-value goods and components from Asia, increasing costs for shippers and carriers.
Freight Shipping Demand Metrics
The Cass Freight Index, which measures North American freight volumes across all modes, has trended mostly negative YoY, reflecting sustained soft freight demand despite broader economic growth. As of Q2 2025, the index remains in mild contraction territory (-3%), suggesting freight markets have yet to see a decisive rebound. This aligns with reports of soft volumes in both truckload and LTL sectors.
Cass Freight Index: % Change by Quarter

Source: Cass Freight Index
Freight Supply Metrics
FMCSA data through June 2025 shows a continued rebalancing of carrier supply. New carrier authorities have fallen significantly from their 2021-2022 peaks, stabilizing near 4,000 per month, while carrier revocations remain elevated, averaging 5,000-6,000 per month. This indicates that capacity added during the pandemic is steadily exiting the market. The gap between revocations and new entrants suggests ongoing contraction in available carrier supply, which should gradually tighten capacity. However, the adjustment has yet to elevate rates, reflecting a slower, sustained correction rather than a sharp supply shock.
New Authorities & Revocations (FMCSA)

Source: Federal Motor Carrier Safety Administration (FMCSA)
Truckload Spot & Contract Rate Forecast
What is the Beon™ Band?
The Beon™ Band rolls up YoY quarterly averages of spot and contract freight data to create projections for future freight cycles. This Band is the outcome of the relationship between freight supply and freight demand, with freight demand being driven by the macroeconomic demand indicators. When we overlay the Beon™ Band with the demand curve in a single chart, we can see demand’s influence on the to-the-truck costs.
TL Spot & Contract Cost Curve: %YoY Change by Quarter

Source: Beon Band – Transportation Insight Holdings
BeonBand and Economic Indicators
When the Beon™ Band is overlayed with the macroeconomic indicators of freight demand, we can understand how some of these factors impact freight rates and thereby forecast where we see the market going over the next couple of quarters.

Freight Rate Forecast
Spot Freight & Contract Rate Outlook
- Linehaul spot rates ended Q2 slightly down at -0.2% YoY, underscoring national volume regression and aligning with tender rejections holding below 10% through the first half of the year. Without a major policy shift, this trend is expected to persist in Q3. Global tariff negotiations fluctuate demand timing, but do not spark a sustained increase in domestic consumer demand, exerting downward pressure on short-term rates. Seasonal volatility remained present in Q2 but was less pronounced than in prior years. Many shippers are taking a wait-and-see approach, uncertain about future cost pressures and reluctant to switch providers or change procurement strategies, which is keeping market activity subdued. Capacity constraints, particularly for refrigerated freight, are anticipated in the Midwest, Pacific Northwest and rural Northeastern states, with the most significant rate volatility expected in early to mid-October.
The transportation industry has seen a change. Traditional freight cycles as we knew them, are they gone? Did technology and data level the playing field? Or do the old cycles still exist but supply and demand have been balanced these last couple years?
We think innovation through data, visibility, and integrated supply chain efficiencies has created a market that moves in real time, not as much in predictable seasonal patterns. Old school and new school have met. The basis of supply and demand is still there, but the use of real-time data and technology has made supply chains more efficient. Typical patterns and small supply or demand surges are now absorbed with minimal impact, while only larger, unpredictable events will continue to create meaningful market disruptions. The winners in this new environment will be those who align their strategies with data, rather than relying on outdated more traditional assumptions about how the market ‘should’ behave.

Drew Herpich
Chief Commercial OfficerPort to Porch Market Forecast
Drayage Shipping
U.S. importers have front-loaded shipments to get ahead of anticipated tariffs following the April pause on reciprocal tariffs with China. The lack of clarity on tariff percentages during the pause led many importers to maximize inbound volumes, softening the upcoming peak season. Inventory levels remain elevated, and shippers are increasingly opting for cost-efficient, slower transit solutions, with intermodal volumes up 6% YoY according to SONAR. This shift reduces demand for dray/transload services in favor of more inland and local drayage. Ocean import volumes are trending down, with new bookings to the U.S. down 11% YoY and NRF Global Port Tracker forecasting a 5% YoY decline overall, including projected drops of up to 21% YoY between September and December.
Full Truckload Freight
The Cass Truckload Linehaul Index closed Q2 with a 1.1% year-over-year increase, marking a 0.3% deceleration from Q1 due to macroeconomic pressures. Ongoing tariff negotiations between the United States and global trade partners have led to a more strategic approach to imports and exports, tempering demand even amid seasonal spikes. As we move into Q3 2025, we expect modest changes in FTL contract rates, with a slight upward bias possible given carrier operational costs have risen approximately 3.5% from 2023 to 2024, according to the American Transportation Research Institute (ATRI). Stable inventory levels will likely limit significant rate movement.
Less-Than-Truckload Freight (LTL) Shipping
LTL carriers continue to emphasize disciplined pricing—echoed again in recent GRI announcements—but the persistent market softness is eroding their leverage, as reflected in the declining average contractual renewal increase. Many in the LTL industry fear this soft market will be following us into 2026 now.
The much-anticipated NMFC revisions took effect on July 19, 2025. The switch has unfolded smoothly—some have even dubbed it the “LTL Y2K”—but our internal teams are closely monitoring customer data to ensure any potential impacts are identified and mitigated swiftly.
As FedEx Freight continues to restructure ahead of their spin off next year, news is coming out on areas of focus: Small businesses customers will be a top priority along with growing their share of e-commerce customers, and a focus on grocery customers. FedEx Freight also has acknowledged that an upgraded billing experience and pricing transparency will be key in satisfying new and existing customers.
Parcel Shipping
Parcel carriers continue to cut costs and expand their service territories while attempting to increase revenue in 3Q25. For the first time ever, UPS has offered their union drivers a buyout. Non-national parcel carriers are reaching new markets to better serve their customers and e-commerce shippers.
- GLS is now servicing the Dallas market.
- Veho expanded their e-commerce reach into St. Louis, Cleveland and Pittsburgh.
- UniUni launched a seamless cross-border delivery offering into Canada.
However, the influx of parcel carriers has created a very competitive pricing market, eating into FedEx, UPS and USPS market share while Amazon is starting to deliver more of their own volume and speeding up their service to rural areas. On August 18, FedEx and UPS updated their dimensional weight rounding principles, and the USPS released their new Merchant Card. This USPS change increases Priority Mail rates and signals they want shippers to move more volume to Ground Advantage. As of August 13, both UPS Ground and FedEx Ground’s Fuel Surcharge are at 20.5%, and UPS Air and FedEx Express are at 19.5%.
Core Macroeconomic Metrics
GDP
The latest GDP report showed that U.S. real GDP grew at an annualized rate of 2.8% in Q2 2025, outpacing Q1’s 2.4% growth and signaling resilient economic momentum. Consumer spending remained a key driver, supported by stable labor markets and moderate income gains, while business investment saw a rebound in equipment and intellectual property. Net exports contributed modestly as global demand improved, though housing investment remained flat. For freight markets, sustained GDP growth points to steady baseline demand for goods movement, but sector-specific performance will vary. Strong consumer-led growth benefits retailers, while industrial freight will depend on manufacturing and export trends.
PCE and Consumer Spending
The June 2025 Personal Income and Outlays report showed personal income and disposable personal income both rose 0.3% month-over-month, with personal consumption expenditures also up 0.3%. Real disposable income was flat, while real PCE increased 0.1%, indicating that inflation absorbed much of the income gains. Spending growth was led by services (+$40.1B) and goods (+$29.9B), with durable goods flat. The PCE price index rose 0.3% MoM and 2.6% YoY, with core PCE up 2.8% YoY, suggesting inflation is nearly at target. For freight markets, steady spending supports demand, but limited growth points to continued cost sensitivity and careful inventory management.
Consumer Confidence and Purchasing Power
The latest Conference Board Consumer Confidence Index shows a modest uptick, signaling improving sentiment despite ongoing economic uncertainty. The Present Situation Index rose, reflecting consumers’ more positive view of current business and labor market conditions. However, the Expectations Index remained cautious, suggesting concerns over future income, business conditions and job availability. This mixed picture points to stable but measured purchasing power heading into Q3, with discretionary spending likely to remain moderate.
EIA Diesel & Fuel Prices
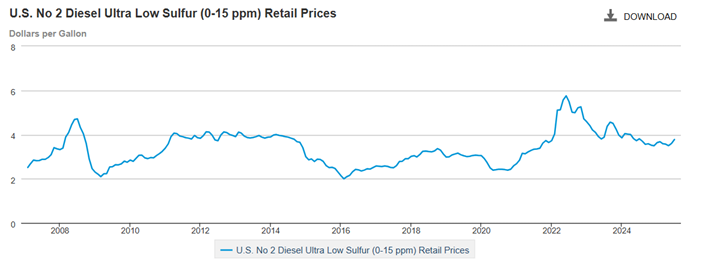
As of mid-August 2025, U.S. on-highway diesel prices average $3.78 per gallon, according to EIA data. This is down from the 2022 peak of more than $5.75 but remains above the pre-pandemic norm near $3.00 (2015–2019 average). The monthly trend shows prices have stabilized in a $3.50–$4.00 range since early 2023, following sharp declines from the record highs of 2022.
Personal Income & Real PCE
In March 2025, U.S. personal income rose by 0.5%, driven by increases in wages and proprietors’ income, particularly within service-producing industries and agriculture. Disposable personal income (DPI) also grew by 0.5%, while personal consumption expenditures (PCE) increased by 0.7%, reflecting higher spending on both goods and services.
The PCE price index remained flat MoM, indicating stable inflation. YoY, the PCE price index increased by 2.3%, and the core PCE index, which excludes food and energy, rose by 2.6%.
The personal saving rate declined to 3.9% in March, down from 4.6% in February, suggesting that consumers are allocating a larger portion of their income to spending.
Inventory to Sales Ratio
The June 2025 Manufacturing and Trade Inventories and Sales report showed total business inventories rising 0.2% month-over-month and 1.6% year-over-year, while sales grew 0.5% MoM and 3.8% YoY. The inventories-to-sales ratio fell to 1.38 from 1.41 a year earlier, indicating a lower turnover despite elevated stock levels. Warehouses remain relatively full compared to sales growth, suggesting that while consumer demand is steady, businesses are cautious about adding new imports. For freight, this dynamic points to muted import volumes in the near term as companies work through existing inventories, limiting upside for containerized and drayage demand.
Industrial Production & Manufacturing Output
The July 2025 Industrial Production report showed total industrial production edging down 0.1% MoM but up 1.4% YoY. Manufacturing output was flat after June’s increase, while mining fell 0.4% and utilities declined 0.2%. Capacity utilization eased to 77.5%, about 2.1 percentage points below its long-run average, signaling slack remains. For freight, flat factory output and softer mining activity point to steady but subdued demand for raw materials, components, and finished goods transport. Automotive and business equipment are relative bright spots, but the lack of a broad rebound suggests only modest near-term transportation growth.
Imports & Exports
Imports: The 2025 inbound ocean TEU volume curve shows a weaker trajectory compared to most prior years, sitting below 2024, 2021, and the 2020 rebound. Volumes started the year soft and, despite improvement through mid-year, remain roughly in line with 2023 levels and below the stronger peaks of 2021–2022. While 2025 imports are trending upward into late summer, the pace lags typical peak season build-ups (especially knowing a lot of this increase comes from Tariff-related pull-forwards). This suggests that front-loaded shipments earlier in the year and elevated inventories are muting import demand, limiting upside for drayage, transload and port trucking activity through Q3.
Exports: The 2025 outbound ocean TEU volume is below most prior years. Volumes were sluggish at the beginning of the year, but there were some signals showing some recovery mid-year in late 1Q25 and early 2Q25. This indicates that U.S. exports are facing headwinds, likely tied to tariff uncertainty and uneven global demand. Although, the weakening of the US dollar, could indicate some export trend reversals in the future (a weaker US dollar means it is cheaper to buy US exports), the muted trajectory and tariff uncertainty suggests limited upside for export-driven freight in Q3.
Freight markets no longer follow predictable cycles, but instead move in real time through data and visibility. Small shifts are quickly absorbed, leaving only large disruptions capable of driving meaningful change. Shippers and carriers that ground their strategies in data, plan proactively, and adapt quickly will be best positioned to control costs and build resilient supply chains in this new environment.
At NTG, we deliver more than capacity—we bring dependable service, fast response times and the technology to help you make informed, agile decisions. However the rest of the year unfolds, we’ll be right there with you to keep your freight—and your business—moving forward.
Nolan Transportation Group (NTG) is a leading logistics provider, offering a wide range of services including truckload brokerage, third-party logistics and specialized transportation like LTL, expedited and drayage. With an extensive network of over 80,000 carriers serving 14,000+ customers, NTG experts leverage the advanced technology of the Beon Digital Logistics Platform, with a customer-centric approach, to deliver efficient, scalable solutions.


On this page:
Subscribe to our Newsletter