Q4 2024 Transportation Outlook
Nov 15, 2024
Q4 2024 Transportation Outlook
In 2024, the freight market challenged traditional expectations of cycle dynamics, highlighting the extended duration of the current downturn. Macroeconomic forces continue to shape the freight landscape, driving notable volatility in demand, capacity and pricing. This evolving environment pushed companies across the sector to adapt to ongoing economic pressures and shifting market conditions.
In the Q4 2024 Transportation Outlook, we will cover:
- How macroeconomic indicators like GDP, consumer spending, industrial production and imports are shaping freight demand.
- The state of freight capacity and its impact on the market.
- Current trends and forecasts for Truckload Spot and Contract Rates.
- Expectations for other transportation modes including Drayage, Less-Than-Truckload (LTL) and Parcel.
- Strategies to prepare for the upcoming peak season and beyond.
We know not everyone has time to read the entire Outlook, so you can click one of the sections below to get exactly what you’re looking for:
- Key Events and What to Watch: GDP, Consumer Spending, Inflation, Interest Rates, Consumer Confidence and Diesel Prices
- Core Macro-Economic Metrics: PCE, Industrial Production, Inventory to Sales and Imports
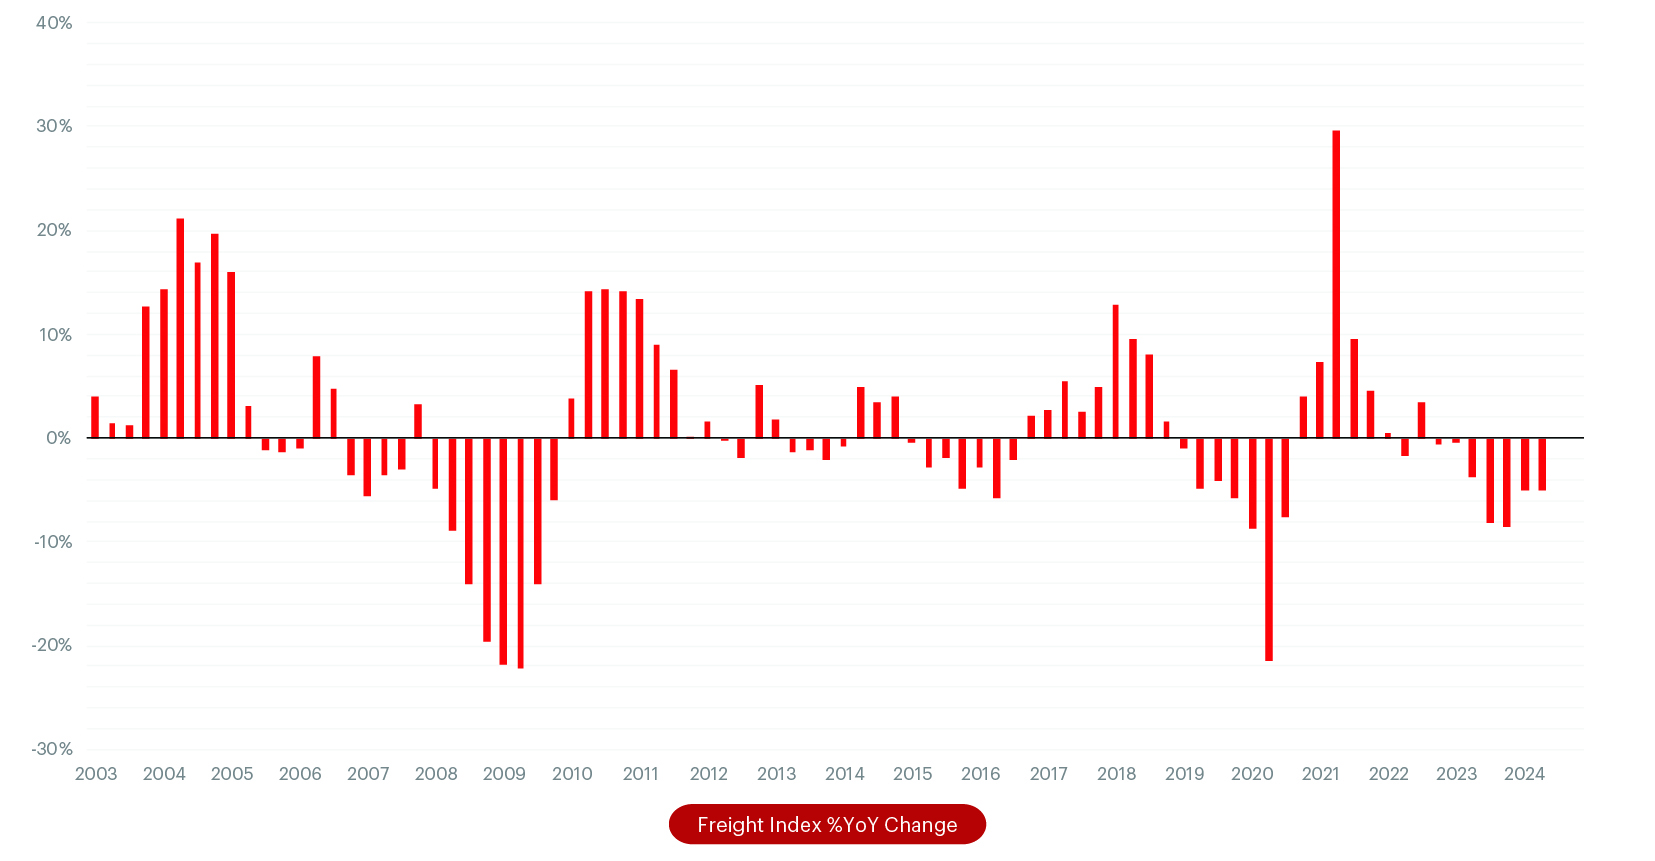
- Freight Shipping Demand Metrics: Cass Freight Index
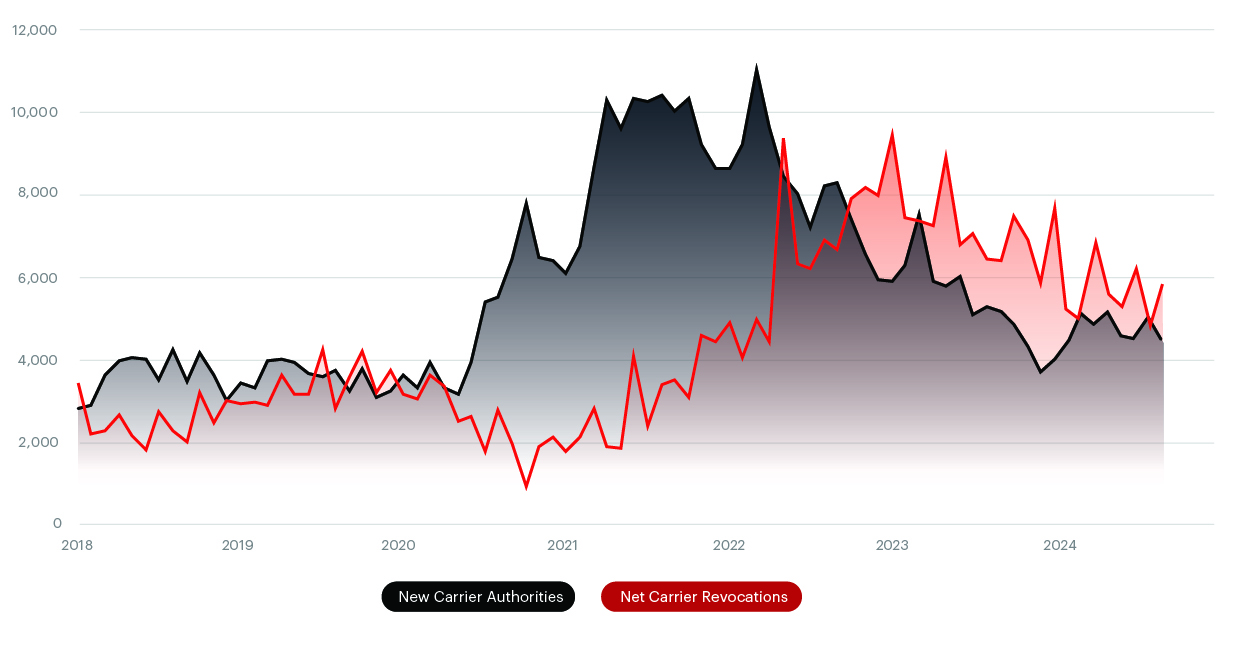
- Freight Shipping Supply Metrics: Grants and Revocations of Operating Authority
- Truckload Spot and Contract Rate Forecasts: Where is the market going?
- Port to Porch Forecast: Drayage, Less-Than-Truckload and Parcel Insights
- Leadership Talking Points: How to communicate these findings to your leadership teams within your organization
Key Events and What to Watch
GDP, Consumer Spending, Inflation & Interest Rates
- According to the Bureau of Economic Analysis (BEA) the US GDP growth rate decreased to an annual rate of 2.8% in 3Q24 from 3.0% in the previous quarter, indicating a slight deceleration in economic growth.
- Lower interest rates, as implemented by the Federal Reserve’s recent rate cut to the 4.50%-4.75% range, can stimulate economic growth by reducing borrowing costs for businesses and consumers.
Consumer Confidence and Purchasing Power
- According to data sourced from the Bureau of Labor Statistics (BLS) the real average hourly earnings for all employees increased by 3.8% year-over-year (YoY) as of 3Q24, alongside a modest 2.6% rise in consumer price index.
Diesel & Fuel Prices
- According to the Energy Information Association (EIA) diesel prices have declined in 2024 relative to 2023, allowing linehaul rates to rise without increasing total transportation costs for shippers. The 3Q24 average diesel price is almost 16% lower than 3Q23.
Core Macroeconomic Metrics
Source: Bureau of Economic Analysis (BEA), Federal Reserve, Census Bureau, Bureau of Labor Statistics
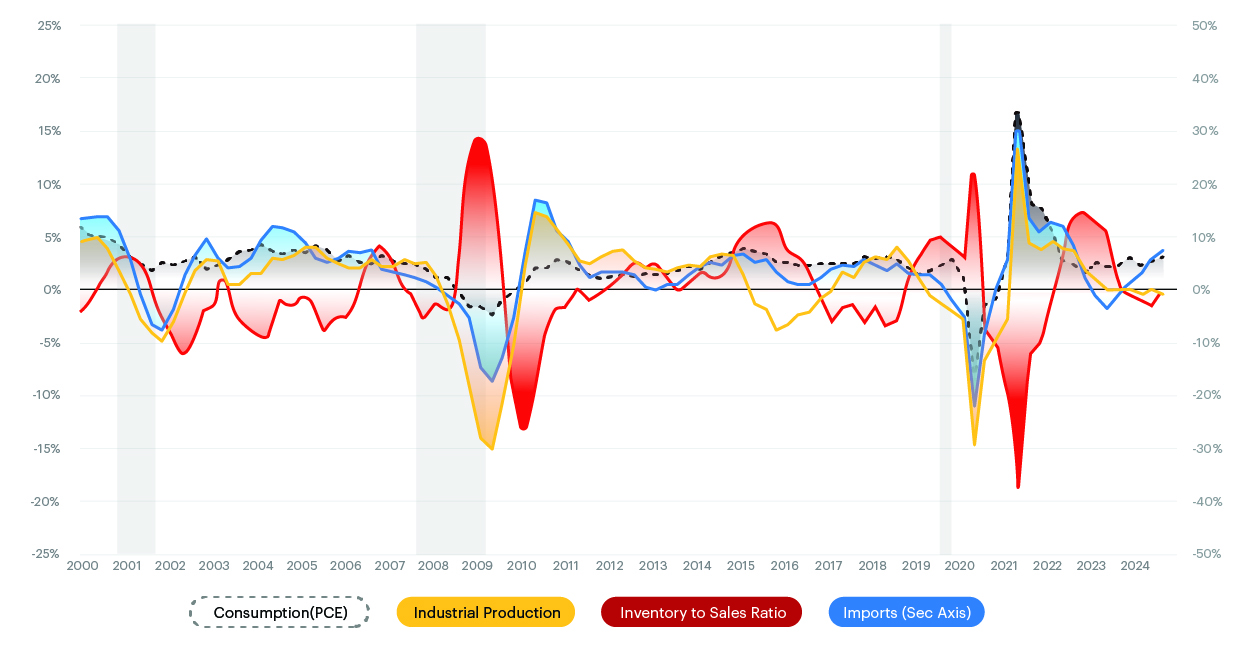
Personal Income & Real PCE
- In 3Q24, personal income rose 5.7% YoY, with disposable personal income also increasing by 5.5% YoY according to the BEA.
- Based on data from the BEA the personal consumption expenditures (PCE) index rose modestly by 0.4% from the 2Q24 to 3Q24, while core PCE index (excluding food and energy) increased by 0.5%, reflecting sustained underlying inflation. Overall PCE rose 2.3% YoY (near the Fed target 2.0%) while PCE core inflation rose 2.7%.
Industrial Production & Manufacturing Output
- From the G.17 report, Industrial Production (IP) for total business decreased by 0.2% quarter-over-quarter in 3Q24 as well as decreasing 0.4% YoY; continuing a negative trend that suppresses freight volumes, as reduced production correlates with decreased freight needs.
- The October 2024 US ISM PMI® indicates a contraction in manufacturing at 46.5%, down from 47.2% the previous month, with new orders and production levels decreasing, suggesting lower freight demand.
Imports & Exports
- According to the GDP report sourced from the BEA, in 3Q24, real imports of goods rose 7.0% YoY, a 2.8% increase from 2Q24. Real exports of goods rose 4.4% YoY in 3Q24 and increased 2.9% from 2Q24. Both of these have caused an uptick in demand for drayage and over-the-road trucking.
Inventory to Sales Ratio
- The US Census Bureau data from surveys shows the ratio of inventory to sales in 3Q24 remained flat compared to 2Q24 at 1.38, driven by inventories and sales growing both by 1% sequentially. Year-over-year, inventory to sales grew by 1.2% from 1.36 in 3Q23. This is driven by YoY inventory growth of 2.4% only partially offset by sales expansion of 1.5%.
Over the past year, we’ve seen a shift away from the traditional cycles, and like many, our predictions for the 2024 freight market didn’t fully align with reality. Since COVID, market fundamentals have changed, reshaping how companies view the supply chain—though it still ultimately revolves around supply and demand. We’ve adjusted our approach, focusing less on ‘being right’ and more on staying adaptable and informed, so we can be a strategic partner for our carriers and customers in this evolving landscape. As we move into 2025, we’ll continue this approach, recognizing that many uncertainties remain.
Freight Shipping Demand Metrics
- The American Trucking Associations’ advanced seasonally adjusted For-Hire Truck Tonnage Index experienced a decrease of 2.1% month over month (MoM) in September 2024 to 113.2. This decrease followed a rise in August, which was the highest tonnage level since February 2023 and showed a positive change with a 0.7% increase from August 2023.
- The Cass Freight Index, which measures shipment volumes, revealed a 0.6% quarter-over-quarter increase and 3.0% year-over-year decline in shipment volumes for 3Q24; this decrease reflects a soft demand environment.
Source: Cass Freight Index
Freight Supply Metrics
Source: Federal Motor Carrier Safety Administration (FMCSA)
More Info:
- The Federal Motor Carrier Safety Administration, known as Clearinghouse II, implemented a new requirement on mid November 2024 that will result in the immediate revocation of driving privileges for nearly 200,000 CDL holders. This is based on the latest data from the Drug & Alcohol Clearinghouse compiled by FMCSA.
- We continue to see net carrier authorities decrease based on the positive net revocations data. We have seen an increase in new carrier authorities, but that was offset by the revocations. As monetary policy continues to ease and the cost of capital gets cheaper from interest rate cuts, we could see more authorities come into the market. This will be heavily dependent on nominal cost per mile increasing and getting to a more lucrative position for carriers.
Truckload Spot & Contract Rate Forecast
What is the Beon™ Band?
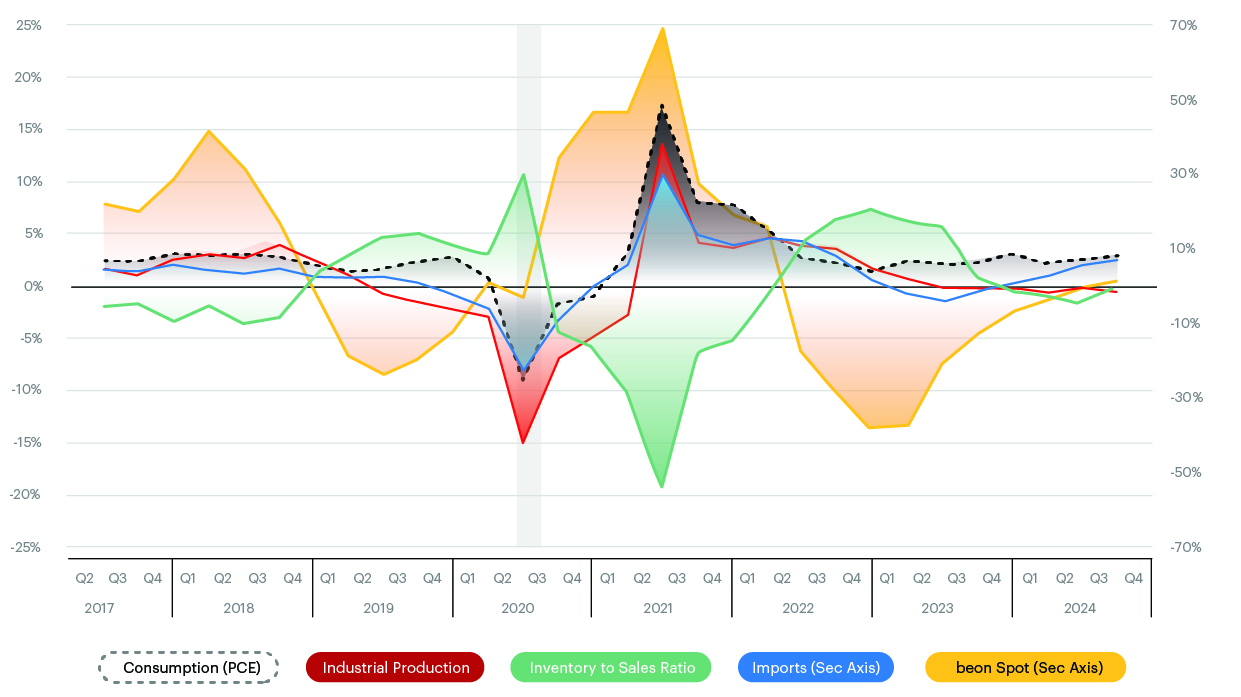
The Beon™ Band rolls up YoY quarterly averages of spot and contract freight data to create projections for future freight cycles. This Band is the outcome of the relationship between freight supply and freight demand, with freight demand being driven by the macroeconomic demand indicators. When we overlay the Beon™ Band with the demand curve in a single chart, we can see demand’s influence on the to-the-truck costs.
Source: Beon Band – Transportation Insight & Nolan Transportation Group
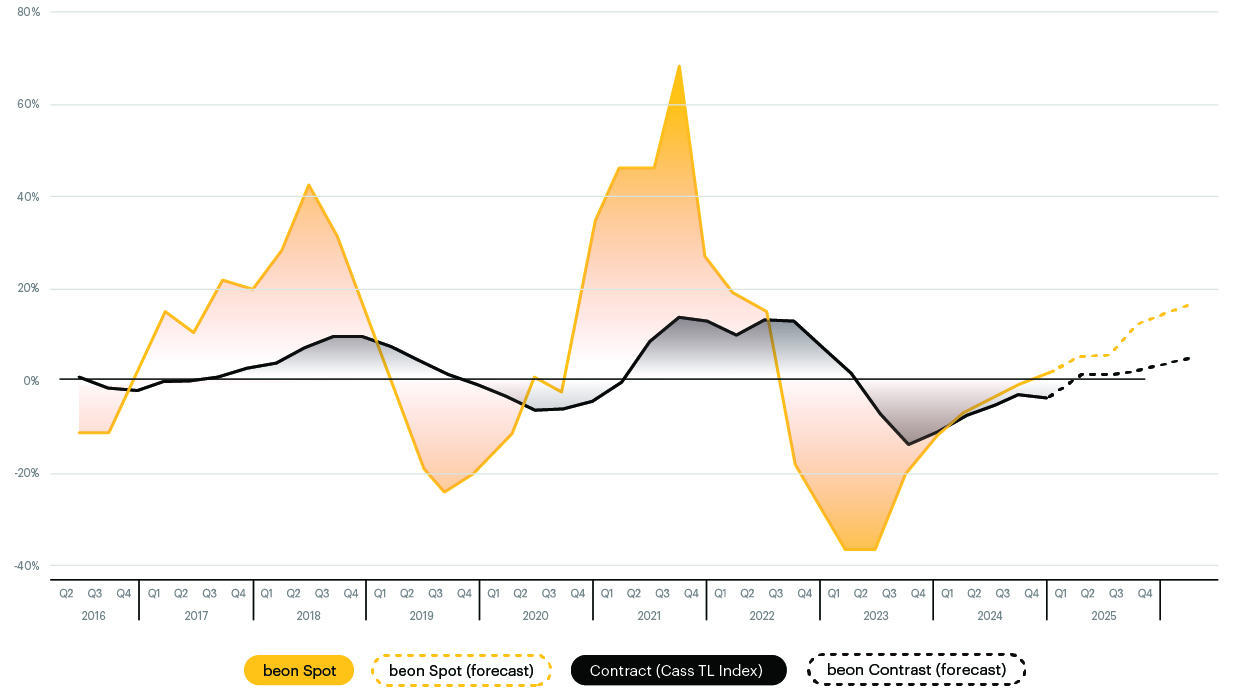
When the Beon™ Band is overlayed with the macroeconomic indicators of freight demand, we can understand how some of these factors impact freight rates and thereby forecast where we see the market going over the next couple of quarters.
Freight Rate Forecast
Spot Freight
- Linehaul spot rates went inflationary for the first time in 3Q24 at 1.3% since 1Q22. By 4Q25, we expect linehaul spot rates to remain inflationary and get up to 17.5% increase YoY. It will be difficult to determine whether the nominal rate difference between spot and contract will be enough to trigger a tender rejection surge.
Contract Freight
- The Cass Truckload Linehaul Index, which measures per-mile truckload linehaul rates, experienced a 0.3% month-over-month increase in September 2024, marking the first rise after four consecutive monthly declines. Year-over-year, the 3Q24 index declined by 3.3%. This trend suggests that while nominal spot rates have begun to climb versus YoY comparisons, contract rates remain under pressure, with widespread increases not yet evident. We expect the contract rates to increase 4.0% YoY by the end of 2025.
Port to Porch Market Forecast
Drayage Shipping
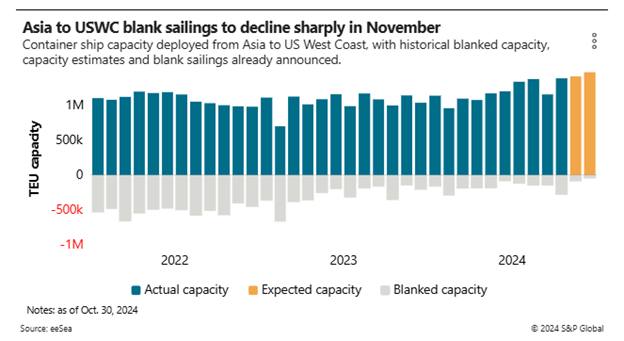
- Shippers are pushing inventory through the expected disruption with the election, International Longshoremen’s Association (ILA) and Lunar New Year, especially on the West Coast.
- Capacity is being added for shipping routes from Asia to US West Coast. Blank sailings or canceled voyages for vessels specifically bound for the West Coast are significantly down, according to eeSea & S&P Global. Volume continues to be steady, which could be due to concerns about potential tariffs being imposed in 2025.
- Key Dates to Remember:
- The current ILA contract is set to expire on January 15, 2025. If no agreement is reached prior to this date operations at US East Coast ports will pause until one is reached. Conversations are ongoing and in the second week of November, ILA broke off talks with the United States Maritime Alliance (USMX) after USMX continued “pushing automation and semi-automation language in its Master Contract proposals that will eliminate ILA jobs.”
- Lunar New Year will fall on January 29, 2025, and it is common for factories to close for one to two weeks during this timeframe.
Less-Than-Truckload Freight (LTL)
- For 2025, shippers should anticipate price increases for LTL shipping between 4 to 6%. Due to consolidation and general softness, price increases should be minimal for the first half of the year.
- Consolidation with less-than-truckload carriers should continue into 2025. While most recently larger carriers like TFI International and Knight-Swift Transportation Holdings are actively talking about LTL acquisitions, small carriers are also expanding through acquisition out of necessity to keep up according to Journal of Commerce. The 40 largest LTL carriers today account for 91.8% of the total LTL sector revenue of $56.6 billion.
- DC Logistics is acquiring GLS Freight/Mountain Valley Express.
- Moran Transportation is acquiring RMX Freight Systems.
- Jack Cooper LTL is in the process of acquiring Standard Forwarding.
- On January 30, 2025, the National Motor Freight Traffic Association (NMFTA) will finalize and release Docket 2025-1, followed by the public meeting on March 3, 2025. Freight class changes will go into effect on July 19, 2025 (previously May 3, 2025). Of the 5,250 items originally in scope, over 3,000 have now been taken out of scope for Docket 2025-1.
- With the NMFTA looking to move more commodities to density-based classification, shippers should seriously consider the timing and benefits of dimensioning systems/technology.
- As the persistent softness in the LTL market persists, carriers are beginning to ease the pricing pressure on shippers. While maintaining pricing discipline overall, carriers are becoming less aggressive with rate increase requests and are open to considering new business opportunities.
Parcel Shipping
The end of the year is typically the busiest time for parcel shippers and small parcel carriers as they announce updates, general rate increases (GRI) and changes to pricing structures for the coming year.
Small parcel shipping will continue to evolve and grow in 2025. As reported by Multichannel Merchant 75% of consumers prioritize free shipping over fast delivery; 81% are willing to spend more to meet free shipping thresholds. However, according to a study by FedEx, 55% of consumers are willing to pay extra for faster delivery options. In looking at more price-conscious US consumers, controlling parcel shipping costs while meeting consumer expectations will be a key priority for parcel shippers in 2025. See below for the updates by parcel carrier.
UPS 2025 Parcel Shipping Updates:
- UPS Surcharges & Rate Changes:
- UPS implemented a 2% surcharge for credit card payments made after October 26, 2024.
- UPS added new zip codes subject to area surcharges and revised Zone alignment starting October 21, 2024.
- UPS is implementing Minimum Billable Weight, meaning packages exceeding certain dimensions are now subject to a 40 lbs. minimum (excluding freight).
- Large Package Surcharge (LPS) will use a new calculation method starting January 27, 2025, based on length, weight or cubic volume.
- Additional Handling Charge (AHC) will shift from length+girth to cubic volume for determining applicability.
- UPS’s annual GRI for ground, air, and international shipping services will rise by 5.9% from December 23, 2024.
- Performance & Volume:
- 3Q24 Results: Consolidated revenue of $22.2B (5.6% increase); U.S. Domestic volumes grew 6.5% YoY.
- Profit Growth: Adjusted Earnings per Share of $1.76, above analysts’ estimates; operating profit is up 47.8%.
- USPS Air Cargo Integration: UPS to profit from the USPS contract (previously held by FedEx) starting in 4Q24.
- Peak Season Preparations:
- UPS boosting air network capacity for Q4 peak season.
- Enhanced operational efficiency to support strong demand in Asia, Europe, and U.S. markets.
FedEx 2025 Parcel Shipping Updates:
- FedEx has launched a new platform offering tools for improved customer operations, including features for increased sales, customer satisfaction, and sustainability. Within the platform, it provides ShopRunner and predictive delivery estimates offer real-time shipping info and incentives for customers.
- FedEx continues ongoing contract negotiations with FedEx pilots, including a 30% pay raise offer rejected by pilots; mediation is ongoing.
USPS 2025 Parcel Shipping Updates
- Transportation Overhaul:
- USPS consolidates drop-off/pickup routes for rural areas, which may delay shipments by one day.
- USPS implemented temporary price adjustments for Priority Mail Express, Priority Mail, and USPS Ground Advantage from October 6, 2024, to January 19, 2025, to cover additional handling costs.
GLS 2025 Parcel Shipping Updates
- GLS is implementing a 5.9% GRI for 2025 shipping rates.
- GLS is also imposing a peak season surcharge of $1.50 for residential parcels between October 28, 2024, and January 19, 2025.
Holiday Shipping Cutoff Dates:
As peak season approaches, the USPS recommends holiday shipping deadlines of December 18, 2024, for Ground service levels and December 21, 2024, for Priority Express and other priority service levels. FedEx and UPS have specific deadlines for holiday deliveries to ensure timely arrival for December 24, 2024 (e.g., UPS Next Day Air: December 23; FedEx 2Day: December 20).
Key Parcel Shipping Takeaways for 4Q24
- Peak Season Surcharges: Expect increased surcharges and service disruptions due to high demand and network optimization efforts across all major carriers.
- Focus on Speed & Flexibility: Enhanced air and ground networks, particularly in Asia-Pacific, position UPS and FedEx to handle increasing demand and address consumer expectations for fast and free shipping.
- Rate Hikes & Surcharges: Both UPS and FedEx will implement significant rate increases in late 2024, with surcharges and service changes impacting domestic and international shipping costs. There will likely be more rate increases throughout 2025, so be sure you have adequate technology and use the most up-to-date rating mechanism to ensure you aren’t overpaying for parcel shipping.
Leadership Talking Points
Here’s how you can address questions your executive team may have about what to anticipate in the coming months.
- State of Freight: The transportation market is inflationary. Rates are rising and we will see jolts in specific markets, however the velocity of this change is manageable. Avoid the spot market by locking in your incumbents early and holding your second, third and fourth providers accountable. Losing reliable providers that know your operation over a few cents here and there isn’t worth it long-term.
Here are some ways to plan ahead in the coming quarters:
- Strategic Capacity Management: Do you have a bid strategy for 2025? Are you building depth within your routing guide? Strengthening relationships with carriers that consistently fulfill commitments enhances network resilience amidst market fluctuations. More frequent bid cycles can help establish routing guides with reliable backup options. When evaluating carrier performance, consider operational factors beyond linehaul costs for a comprehensive view of performance and efficiency.
- Lane Optimization: Which lanes are pain points for your providers? What lanes are driving tender rejections in tight markets? Are there spot lanes that can be converted to contract? Carriers prefer predictable, efficient lanes, which encourages longer commitments, reduces costs and improves service quality. Engage providers for feedback on your shipping and receiving facilities to pinpoint potential improvements. Review lower volume but consistent lanes and discuss the possibility of contract rates with providers. Proactively addressing lanes at risk of market shifts will help you better manage costs and maintain reliable service.
- Value-Add Partnerships: Do you have a partner providing actionable insights? Collaborating with transportation and logistics providers for in-depth analysis can help mitigate the impact of operational disruptions. This partnership can identify cost-saving opportunities and reduce last-minute reliance on the spot market.
As we navigate through the remainder of 2024, it’s critical to stay informed about market trends and be prepared to adjust strategies accordingly. The freight market is poised for change, and those who anticipate and plan for these shifts will be best positioned to succeed in the evolving landscape.
Recent Posts

NTG Honors Truck Drivers During NTDAW 2025

Stay in the Know: Carrier Trends & Market Updates

Q3 2025 Transportation Outlook


