


Q4 2025 Transportation Outlook
Carrier exits outpace new entrants, demand stays soft and stalled inventories plus tariff shifts shape a muted yet sensitive Q4 2025 freight market.


Tech-enabled stability is real but temporary.
For 18 months technology, data and AI have absorbed shocks across the freight market including imports, regulations, weather and labor, creating agility that hides underlying fragility. Nothing has broken the system yet. The question isn’t if disruption comes but what gives first: non-domiciled capacity under compliance pressure, demand under rising rates and normalized tariffs, or housing under record prices (or a spike if 50-year mortgages emerge).
What ends this balance won’t be a slow fade. It will be a jolt big enough to outrun optimization: a new mandate, tariff escalation or a structural consumer shift. Today’s equilibrium is real but temporary. In a system designed for agility, disruption arrives when change outpaces what the system was built to handle.
- Key Themes and What to Watch Out For
- Freight Shipping Demand Metrics
- Freight Shipping Supply Metrics
- Truckload Spot and Contract Rate Forecasts
- Port to Porch Forecast
- Core Macroeconomic Metrics
Key Events and What to Watch
1. Carrier revocations continue to outpace new entrants, accelerated by non-domiciled CDL restrictions and English-proficiency enforcement; rates remain flat, signaling that capacity is leaving too slowly to materially tighten the market.
2. Consumer confidence remains below recession-signal thresholds, and peak-season demand indicators show little improvement. Weak discretionary spending continues to cap freight volumes.
3. Business inventories have flattened, but normalization is not expected until 1Q26. Historically, a positive restocking slope has coincided with major spot-volume spikes, making inventory trajectory an important demand catalyst to watch.
4. The extension of the China tariff pause into November, and the rollout of new reciprocal tariffs, continues to distort importer behavior. Frontloading earlier in the year has muted Q4 import strength, increasing sensitivity to any future policy shifts.
5. Optimization, visibility and real-time data continue to absorb short-term shocks, reducing traditional seasonal volatility. However, this also means that the next market-moving event will likely need to be large and sudden regulatory, geopolitical or consumer-driven to break through the system’s current efficiency barrier.
Freight Shipping Demand Metrics
The latest Cass Freight Index shows freight demand remains soft, with shipments still declining year over year and offering no sign of a traditional peak-season rebound. At the same time, the expenditures index is holding up despite weaker volumes, indicating freight spend is being driven more by rate mix and cost inflation than by true demand. This disconnect reinforces a market with loose capacity and shipper pricing leverage, where stability is being maintained by efficiency rather than growth. Overall, the index signals a freight environment that is steady but fragile—healthy enough to function, but highly vulnerable to any external shock that could disrupt the current balance.
Cass Freight Index: % Change by Quarter

Source: Cass Freight Index
Freight Supply Metrics
FMCSA data through September 25 shows a continued rebalancing of carrier supply. New carrier authorities have fallen significantly from their 2021–2022 peaks, stabilizing near 4,500 per month, while carrier revocations remain elevated, averaging 5,000–6,000 per month. Net revocations continue to outpace new authorities, signaling that capacity added during the pandemic is still exiting the market. The persistent gap between revocations and new entrants suggests ongoing contraction in available carrier supply, which should gradually tighten capacity. However, this adjustment has yet to lift rates, reflecting a slower, sustained correction rather than a sharp supply shock.
New Authorities & Revocations (FMCSA)
Source: Federal Motor Carrier Safety Administration (FMCSA)
Truckload Spot & Contract Rate Forecast
What is the Beon™ Band?
The Beon™ Band rolls up Year-over-Year quarterly averages of spot and contract freight data, creating projections for future freight cycles. This Band is the outcome of the relationship between freight supply and freight demand, with freight demand being driven by the macroeconomic demand indicators. When we overlay the Beon™ Band with the demand curve in a single chart, we can see demand’s influence on the to-the-truck costs.
TL Spot & Contract Cost Curve: %YoY Change by Quarter

Source: Beon Band – Transportation Insight Holdings
Freight Rate Forecast
Spot Freight & Contract Rate Outlook
- Linehaul spot rates ended 3Q25 down at -3.3% YoY, demonstrating volume regression and aligning with tender rejections holding in the mid-single digits. Without a major policy shift, this trend is expected to persist in 4Q25. Seasonal volatility remained present in 3Q25 but was less pronounced than in prior years. Many shippers are taking a wait-and-see approach, uncertain about future demand and cost pressures. For 2026, we anticipate spot rates to be up 4.3%, peaking at +9% YoY in 4Q26. Contractual rates are expected to peak at +5.5% in 4Q26. These projections are expected because of continued capacity exits accelerated by non-domiciled CDL restrictions and English Language Proficiency Tests, as well as steady consumer demand driven by interest rate cuts and inventory normalization.
The transportation industry has adapted, but it has only delayed disruption. Technology, data, and real-time visibility have redefined how the market responds. Traditional freight cycles haven’t disappeared; they’ve been muted, managed by systems that rebalance faster than ever.
Today, we operate in a landscape where the fundamentals of supply and demand remain, but the feedback loop is instantaneous. Surges that once moved markets are now absorbed with little noise. But that efficiency comes with risk: when change arrives faster than the system can adjust, disruption hits harder.
The next cycle won’t be from seasonal drift but from shocks: a regulatory pivot (ELD mandate), a geopolitical move (tariffs) or a break in consumer momentum. The winners will be those who plan not just for the predictable, but for the intensity of change itself.

Drew Herpich
Chief Commercial OfficerPort to Porch Market Forecast
Drayage Shipping
U.S. importers remain sufficiently stocked as we move into Q4 because of frontloading in the spring. For the remainder of the year, we anticipate that importers will rely largely on their current inventories to make it through the holiday season, and the NRF is anticipating closing the year with a 3-4% YoY increase in retail sales. November and December 2025 are shaping up to be the slowest months for U.S. imports in 2025 with projections currently for volume to be down 14%-17% YoY, according to the NRF’s Global Port Tracker.
According to SONAR, last quarter’s trend of increasing international container traffic as an intermodal solution rather than direct drayage has significantly decreased, down 13% YoY, revealing the likelihood that there is just plainly not much drayage activity. There is the potential for a small volume increase from China with the trade deal in place, but importers generally remain hesitant. Current consumer demand points toward a strong likelihood that Q1 2026 will also get off to a weaker start than anticipated with soft U.S. consumer sentiment resulting in longer timeframes for inventories to be depleted.
Full Truckload Freight
FTL market conditions remain stable but soft, with dynamics that point to a seasonally typical Q4 tightening rather than a structural shift. Tender rejections are expected to rise as normal during the fourth quarter, which will lift spot rates, but these movements should be viewed as seasonal noise and not a true inflection point. Contract compliance remains high, with shippers deliberately honoring incumbent carriers as long as pricing holds. This behavior suggests that many customers expect spot rate increases sometime in 2026 and want to preserve trusted relationships before conditions tighten. However, overall demand is still materially weaker. At the same time, net carrier revocations are not removing capacity fast enough to materially rebalance the market. Together, these factors point to an FTL sector that will see short-term seasonal firmness but remains fundamentally oversupplied until a true demand-led recovery emerges.
Less-Than-Truckload Freight (LTL) Shipping
The LTL Producer Price Index (PPI) remains elevated and is still posting solid year-over-year gains, even as the freight market stays soft. At the same time, there are early signs that the pricing discipline which has defined the sector in recent years is starting to come under pressure at the margins. Several publicly traded carriers are reporting year-over-year tonnage declines and softer daily shipment trends, with more mixed yield performance and growing evidence of selective pricing concessions, even as ex-fuel yields remain above prior-year levels.
A major driver of today’s dynamics is the group of carriers that acquired terminals out of the Yellow Freight bankruptcy to expand their networks. After investing heavily to grow their footprints, many now need to “feed the beast” by adding density to new geography and filling lanes of need. This is translating into carriers more aggressively pursuing targeted volumes. Pricing discipline has not disappeared, but these are clear early indications that some carriers are increasingly willing to trade yield for network balance where it makes strategic sense.
As carriers accept that today’s demand environment may persist into 2026, many are also pursuing segments of the LTL market they historically avoided. One notable example is food and grocery, a vertical known for tough consignees, tight delivery windows and higher-touch operations. In 2026, more carriers that previously steered clear of this freight are likely to test whether they can make the operational model and pricing economics work. Those that succeed will gain access to a more volume-stable segment than much of the broader LTL market. For shippers, the most compelling pricing and capacity opportunities will emerge where freight helps carriers fill expanded networks or aligns with these target verticals — making carrier-by-carrier strategy and segment focus increasingly important in LTL negotiations.
Parcel Shipping
Parcel carriers continue to find ways to increase revenue. UPS and FedEx both announced 5.9% 2026 General Rate Increases (GRI); however, the UPS GRI will go into effect December 22, 2025, two weeks prior to FedEx’s effective date of January 5, 2026. OnTrac also plans to increase 2026 rates and announced an average GRI of 6.7%, effective January 3, 2026. Amazon plans to increase fulfillment fees for third-party sellers by an average of $0.08 per unit sold starting January 15, 2026.
Parcel volumes are expected to increase by approximately 5% YoY during the Q4 peak season. However, major carriers like UPS and USPS might see flatter growth as volume shifts to Amazon, Walmart and Target internal networks, as well as regional carriers such as OnTrac, Better Trucks, Veho and SpeedX. Consumers, fatigued by inflation and high shipping costs, are becoming more price-sensitive, and there is a growing preference for cheaper, slower delivery options over expedited shipping.
Core Macroeconomic Metrics
Consumer Confidence
The latest Consumer Confidence reading shows a consumer that is increasingly cautious heading into late 2025. Overall confidence slipped to 94.6, marking a modest decline but reinforcing a broader trend of softening sentiment. While consumers’ views of current conditions improved, their outlook deteriorated more meaningfully, with the Expectations Index falling nearly 3 points to 71.5. This is significant because expectations have now remained below the recession-signal threshold of 80 since February 2025, indicating persistent pessimism about income, job stability and economic conditions over the next six months.
Inventory Levels
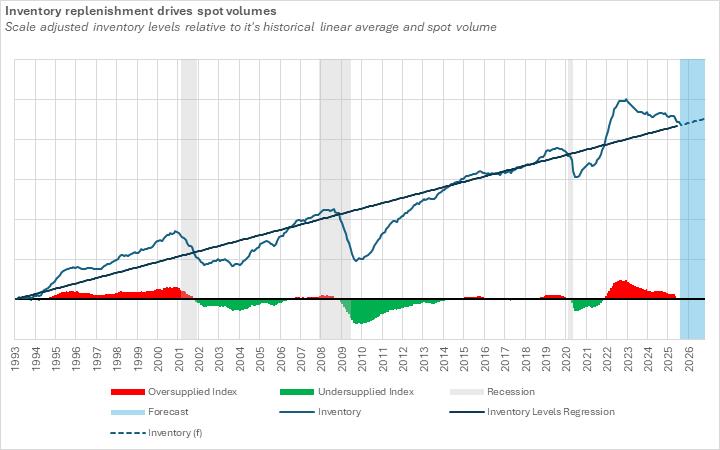
Our Project Lead, Dylan Poulsen, has been doing some research to establish a quantitative relationship between inventory restocking and total freight volumes. As part of his work, he examined inflation-adjusted total business inventory trends which have been declining steadily since 4Q22, but levels are expected to resume a more normal trajectory in 1Q26. Since 1993, inventory levels have generally followed a long-term linear average, unless there is a recession that causes businesses to significantly reduce inventory exposure, or a post-recession recovery where inventory levels accelerate to normal levels. When the inventory levels are above the long-term linear average, we are indicating saturated inventory levels (red shaded bars). When inventory levels are below the long-term linear average, we are indicating undersupplied inventory levels (green shaded bars). Historically, when inventory replenishment shifts into a positive slope, spot-volume spikes follow, suggesting that the next real freight acceleration will be tied directly to restocking cycles.
EIA Diesel & Fuel Prices
As of November 2025, U.S. on-highway diesel prices average $3.837 per gallon, according to EIA data. This is down from the 2022 peak of more than $5.75 but remains above the pre-pandemic norm near $3.00 (2015–2019 average). The EIA expects the 2026 retail diesel price to decrease by 4.3% to an average of $3.50 per gallon for the year.
Imports
Inbound ocean twenty-foot equivalent unit (TEU) trends show a strong start to 2025, with the data indicating that Q1 volumes are tracking above 2023 and 2024, though slightly below the 2022 surge. This strength aligns with Lunar New Year frontloading, tariff uncertainty and residual effects from labor risk at U.S. ports. However, NRF/Hackett’s full-year import forecast of 24.9M TEUs signals a shift: while early-year volumes are holding, 2H25 monthly forecasts decline below 2024 and 2023 levels, particularly from September through December. This suggests a front-loaded freight cycle where shippers pulled forward inventory early in the year from tariffs and are now stocked.
Conclusion
Technology and data are keeping freight steady even as demand stays soft and capacity exits slowly. With revocations still outpacing new entrants, rates remain flat and the market feels balanced but fragile. Inventories are the key signal: when restocking turns positive, the spot market moves first and contracts follow. Policy remains the wild card, with tariff and compliance shifts continuing to shape import timing and shipper behavior.
Across modes, TL shows seasonal firmness without a structural turn, LTL is easing pricing discipline at the edges as carriers chase density, and parcel is seeing volume shifts from major carriers to alternative networks as consumers become more content with cheaper, slower delivery. Keep an eye on inventories into 1Q26 along with tariffs, diesel and consumer sentiment for signs of the next move.
Need help with your next load? Request a quote from NTG to get moving quickly.
Nolan Transportation Group (NTG) is a leading logistics provider, offering a wide range of services including truckload brokerage, third-party logistics and specialized transportation like LTL, expedited and drayage. With an extensive network of over 80,000 carriers serving 14,000+ customers, NTG experts leverage the advanced technology of the Beon Digital Logistics Platform, with a customer-centric approach, to deliver efficient, scalable solutions.


On this page:
Subscribe to our Newsletter