Q2 2024 TRANSPORTATION OUTLOOK
May 10, 2024
Q2 2024 Transportation Outlook
The bottom of the market is past us. Yet, we’re entrenched in a prolonged recovery period which shifted our goalpost for the next cycle’s peak by a quarter.
In prior Transportation Outlook releases, we have used the analogy that the freight market is like a faucet. While the faucet currently is open (just not all the way), we believe later this year that the market will open more increasing overall market volatility.
Are you ready to navigate the rest of this year with a sound strategy? Our Q2 2024 Transportation Outlook informs you about key events that will influence the timing and magnitude of that volatility.
We will cover:
- How are macro-economic indicators such as imports, Personal Consumption Expenditures (PCE), the inventory-to-sales ratio and industrial production influencing freight demand?
- How much capacity remains from the pandemic and when will there be a balance of supply and demand?
- What is the current state of Truckload Spot and Contract Rates and where are we predicting rates to go over 2024?
- What can be expected for other transportation modes like Drayage, Less-Than-Truckload (LTL) and Parcel?
We know not everyone has time to read the entire Outlook, so you can click one of the sections below to get exactly what you’re looking for:
- Key Events and What to Watch: GDP, Consumer Spending, Inflation, Interest Rates, Consumer Confidence, Carrier Attrition, Presidential Election, Imports and Parcel News
- Core Macro-Economic Metrics: PCE, Industrial Production, Inventory to Sales and Imports
- Freight Demand Metrics: Cass Freight Index
- Freight Supply Metrics: Grants and Revocations of Operating Authority
- Truckload Spot and Contract Rate Forecasts: Where is the market going?
- Port to Porch Forecast: Drayage, Less-Than-Truckload and Parcel Insights
- Leadership Talking Points: How to communicate these findings to your leadership teams within your organization.
In The News and What to Watch
GDP, Consumer Spending, Inflation & Interest Rates
- The US GDP growth slowed to 1.6% annually in 1Q24, impacted significantly by increased imports but supported by strong consumer spending, especially in services.
- Consumer spending on goods rebounded in March, rising 1.1% month-over-month (MoM), driven by higher expenditures on energy goods, recreational items, and food and beverages. Overall Personal Consumption Expenditures (PCE) was at 3.1% year-over-year (YoY) in March which was the highest in past 24 months.
- Despite the overall weak GDP growth, sectors such as freight transportation saw growth (1.8% in 1Q24), boosted by strong imports and investments in residential construction and transportation equipment.
- The Fed is facing important decisions regarding interest rates amid economic uncertainties and a stalled cooling of inflation, which has kept rates at a 23-year high.
- No interest rates came out of the Fed meeting in May, and the Fed expressed a desire to see more consistent macroeconomic and inflation trends before considering a rate change. Most analysts believe the next rate cut will be delayed until later in 2024 or into 2025.
Consumer Confidence and Purchasing Power
- One of the leading indicators of consumer spending is consumer confidence, or how the consumer feels about the current and future economic situation. The Conference Board Consumer Confidence Index dropped for the third consecutive month to 97.0 in April from a revised 103.1 in March, marking its lowest point since July 2022. The Present Situation Index, reflecting current business and labor market conditions, fell slightly, while the Expectations Index, indicating short-term prospects for income, business, and labor, dropped to 66.4.
- In March, disposable personal income, personal income less personal current taxes, increased by 0.5% MoM, rising from February’s 0.3% gain and matching market expectations.
- The personal savings rate decreased in March to 3.2% versus February’s 3.6% reading.
Carrier and Brokerage Attrition
- Carrier revocations or exits continue to outpace new grants of authority for the sixth consecutive quarter, confirming the continued exit of capacity in an oversupplied market.
- More revocations will result from rising diesel fuel prices over the remainder of 2024, in which the US Energy Information Administration (EIA) projects diesel retail prices will climb to $4.19 per gallon in Q4 2024.
- Since December 2022 to April 2024, 11.4% of freight brokerages have revoked their operating authority, according to Licensing and Insurance data from the FMCSA. In the last 4 months alone, 4% of those revocations occurred, indicating a large shift in who is managing freight for shippers and can cause routing guide disruption.
US Presidential Election: Uncertainty and Caution
- Presidential election years historically inject uncertainty into the market, causing consumers and businesses to delay major purchases and investments, particularly affecting sectors like healthcare, energy, defense and supply chain due to potential policy changes.
- This hesitancy affects the transportation and logistics sector with fluctuations in demand, disruptions in global supply chains due to regulatory uncertainties and the need for strategic adjustments in response to potential policy changes.
- Historical data from the 2016 and 2020 election periods highlight disruptions in freight volumes and supply chain configurations, driven by uncertainty around trade policies and tariffs.
- In this election year, one of the topics that has the potential to impact the freight industry most is the Corporate Tax Policy, which will determine tax rates for corporations.
- While presidential elections lead to temporary market disruptions and strategic caution, these effects are generally short-lived, with activities and demand stabilizing post-election, urging stakeholders to focus on long-term trends and planning.
Mergers and Acquisitions Back on the Upswing?
- Morgan Stanley Research predicts a 50% surge in M&A deal volumes in 2024 compared to the previous year, driven by heightened corporate confidence and easing global economic concerns, which will mark a recovery from a low activity level, the weakest since 2004.
- Both non-financial companies and private market investors have accumulated a considerable $8.1 trillion in unallocated capital, ready to drive a strong demand for mergers and acquisitions.
Imports
- According to the monthly Global Port Tracker report from the National Retail Federation (NRF) and Hackett Associates, containerized US imports for the first half of the year are projected to reach 11.7 million TEUs, an 11% increase YoY.
- The NRF noted that US imports surged by 8.3% in January and 26.4% in February, with expectations of sustained annualized gains continuing through August.
- The Red Sea continues to experience disruptions and shippers continue to reroute vessel traffic to avoid attacks by the Houthis.
Parcel Market Changes, Fuel Surcharges and Contract Changes
- Fuel Surcharges were announced across the board by UPS, FedEx and regional carriers like OnTrac.
- UPS announced it will be the primary air carrier for the United States Postal Service (USPS) beginning in October 2024, ending USPS’s 20-year partnership with FedEx for air cargo. This is part of the Postal Service’s Delivering for America plan to optimize and improve the efficiency of national and local transportation.
- According to an annual report from Pitney Bowes, US parcel revenue has seen the first decline in seven years despite increased parcel volume.
- According to the US Parcel Shipping Index, released in April by Pitney Bowes, US parcel revenue fell 0.03% from $198.4 billion in 2022 to $197.9 billion last year despite a slight parcel volume increase of 0.05% from 21.5 billion in 2022 to 21.7 billion in 2023.
- Of the four largest carriers — the USPS, Amazon, UPS and FedEx — only Amazon grew volumes YoY at 15.7%.
- Amazon and the USPS saw revenue growth, but UPS and FedEx experienced declines in parcel volume and revenue.
- Pitney Bowes expects US parcel volume to reach between 23 billion and 35 billion packages by 2029.
- USPS may end ounce-based shipping.
Core Macro-Economic Metrics
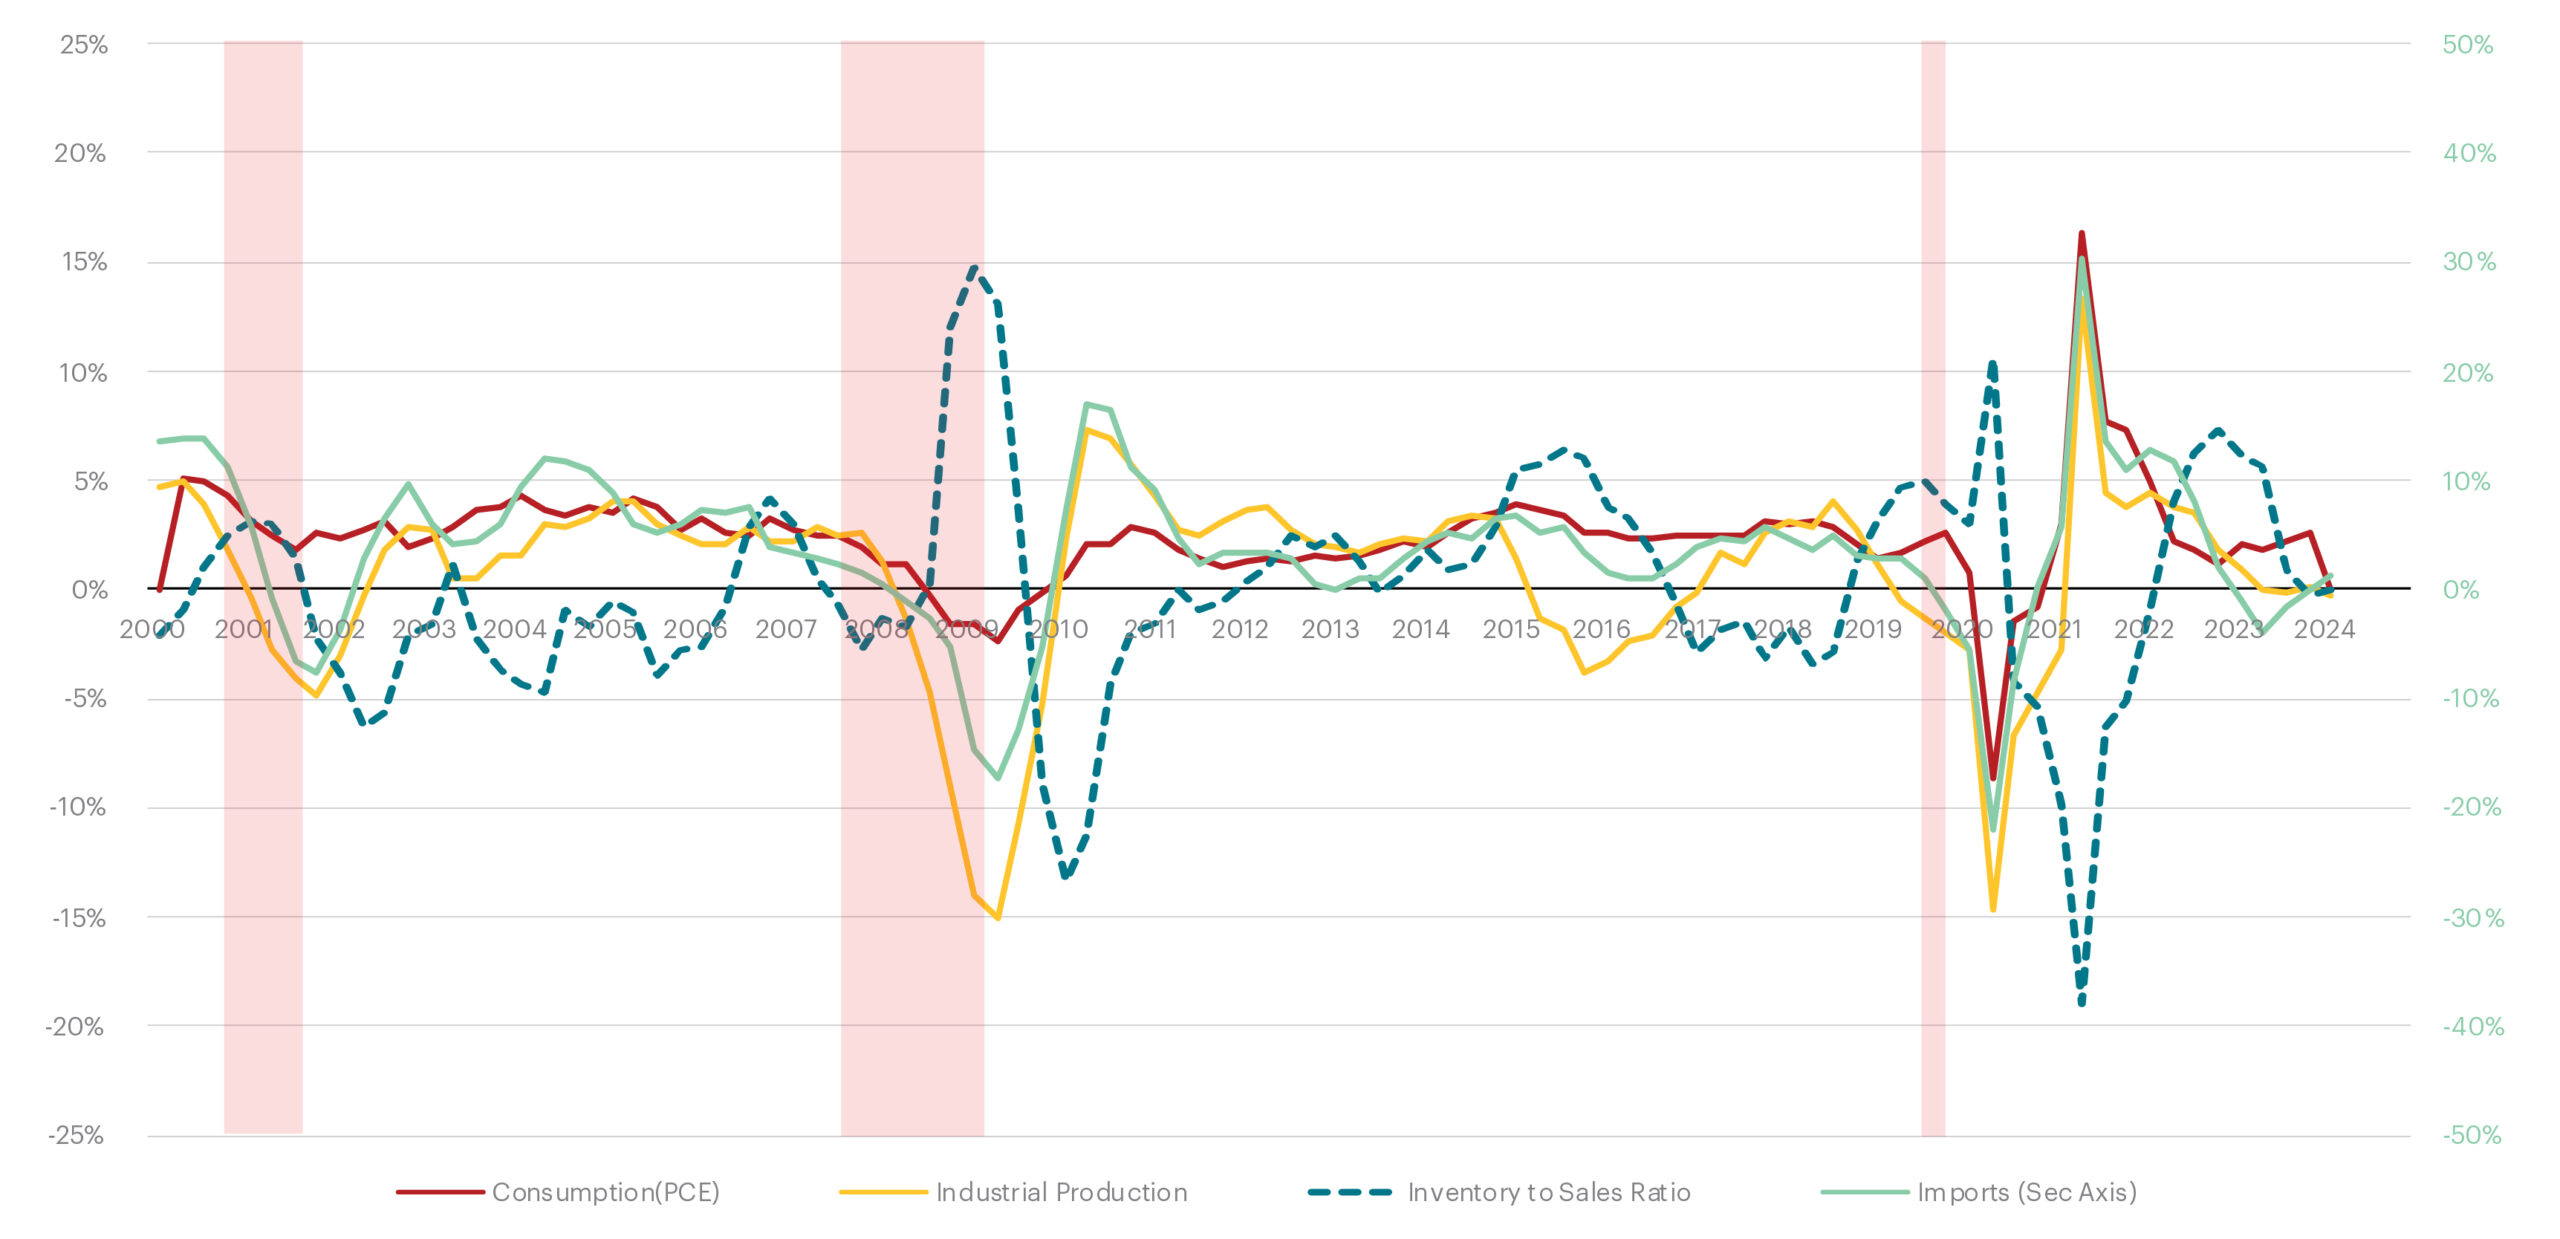
Recent economic data reveals a cautiously optimistic scenario marked by resilience and recovery in various sectors. Despite a 2% drop in real disposable income (adjusted for inflation), Real Personal Consumption Expenditure (PCE) increased by 0.6% in Q1 from Q4, driven mainly by service expenditures, with a notable uptick to 2.4% YoY by March. Industrial production showed slight improvement, and the US manufacturing sector exhibited growth after 16 months of contraction, as evidenced by a March ISM Purchasing Managers’ Index (PMI) of 50.3%.
Additionally, imports saw a recovery with a 1.3% increase YoY in Q1, highlighted by significant gains in maritime container imports. Retail and food services sales also surged to a new all-time high in March, driven by non-store retailers, while the inventory-to-sales ratio declined. These factors combined point toward a dynamic phase of economic recovery with robust consumer activity and revitalized trade and manufacturing sectors.
Source: Bureau of Economic Analysis (BEA), Federal Reserve, Census Bureau, Bureau of Labor Statistics
More Info:
Personal Income & Real Personal Consumption Expenditure (PCE)
- Disposable income dropped to -2% YoY when adjusted for inflation.
- Despite the drop in disposable personal income, PCE increased by 0.6% in Q1 versus the prior quarter, primarily driven by increases in services expenditures.
- On a YoY basis, PCE was reported at +2.4% with durable goods at 2%, non-durable goods at 1.9% and services at 2.7%. Overall spending started low in January at 1.9% YoY, but picked up in March to 3.1% YoY, the highest in the past two years.
- The increase in spending despite lower income indicated that less cash went into personal savings, which dropped from 4% in Q4 of last year to 3.2% in March.
Industrial Production (IP) & Manufacturing Output
- Industrial Production started at –0.7% YoY in January but picked up in March taking the average of Q1 to –0.3% compared to Q1 of 2023.
- Manufacturing Output, on the other hand, improved from -0.2% YoY last quarter to -0.1% YoY in Q1.
- The US manufacturing sector expanded in March after contracting for 16 consecutive months according to the Institute for Supply Management (ISM) PMI report.
- The PMI for March came out at 50.3% against 47.8% in February which is above the threshold for expansion.
- Four of the six largest manufacturing industries surveyed by ISM reported growth in March, which constituted more than 50% of manufacturing GDP.
Imports
- Imports of goods and services in the US finally turned positive to +1.3% YoY in Q1 after four quarters of decline.
- Imports of goods increased to 1.7% YoY, while services improved to -0.3% YoY.
- Maritime Container Imports went further up from 7% in Q4 to 15.4% in Q1 on a YoY basis.
- On average, import volume is 20% higher compared to pre-pandemic levels.
- All the major ports showed a strong double-digit YoY increase in import volume.
Inventory to Sales Ratio
- Inventory to Sales Ratio improved to 1.38 in February after a drop in sales in January.
- On a YoY basis, the ratio went down by 1.1% which indicates that the inventories continue to deplete.
- Retail and Food services sales rose 0.7% in March to a new all-time high after a 1% increase in February.
- Sales were 4.3% higher YoY (more than the rate of inflation), indicating actual quantities of goods sold have also increased YoY.
- The increase in sales was primarily driven by non-store retailers.
Freight Demand Metrics
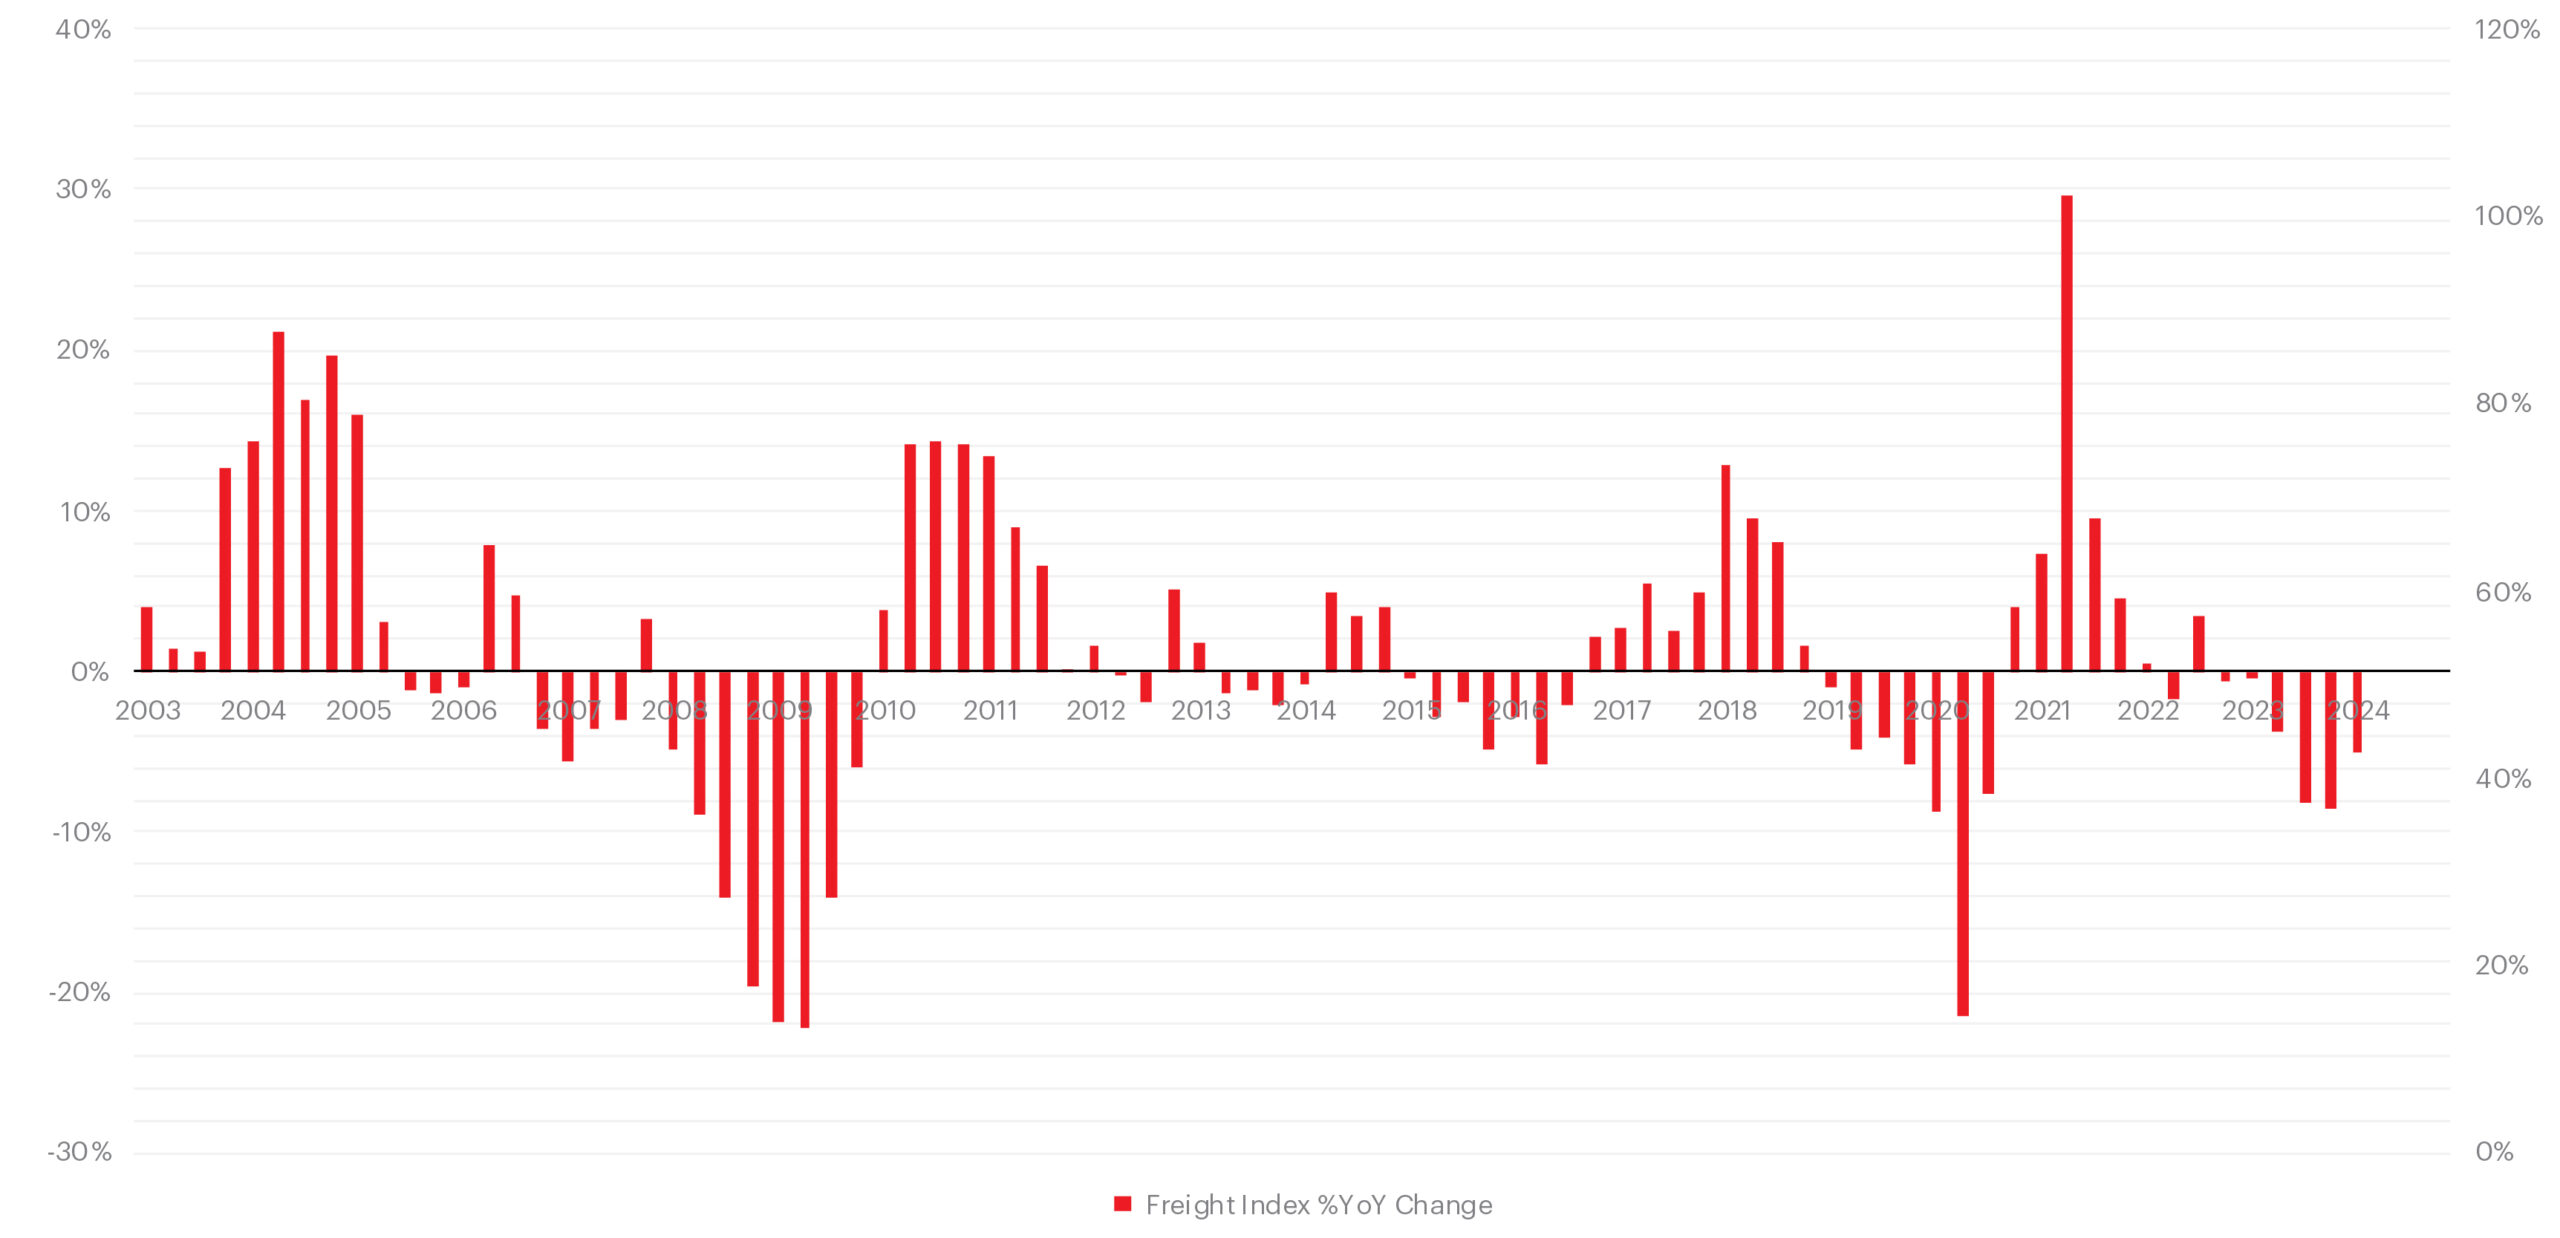
Freight demand showed the first signs of positive growth in Q1 after seven quarters of decline, reaching its lowest point in Q4.
- While on a YoY basis, the volume reported by CASS Freight Index was 5.1% lower than last Q1, there was a 2.1% increase in volume against Q4 despite headwinds of inflation.
- Truckload tonnage reported by the American Trucking Association (ATA) also showed positive growth in Q1 2024.
Source: Cass Freight Index
Freight Supply Metrics
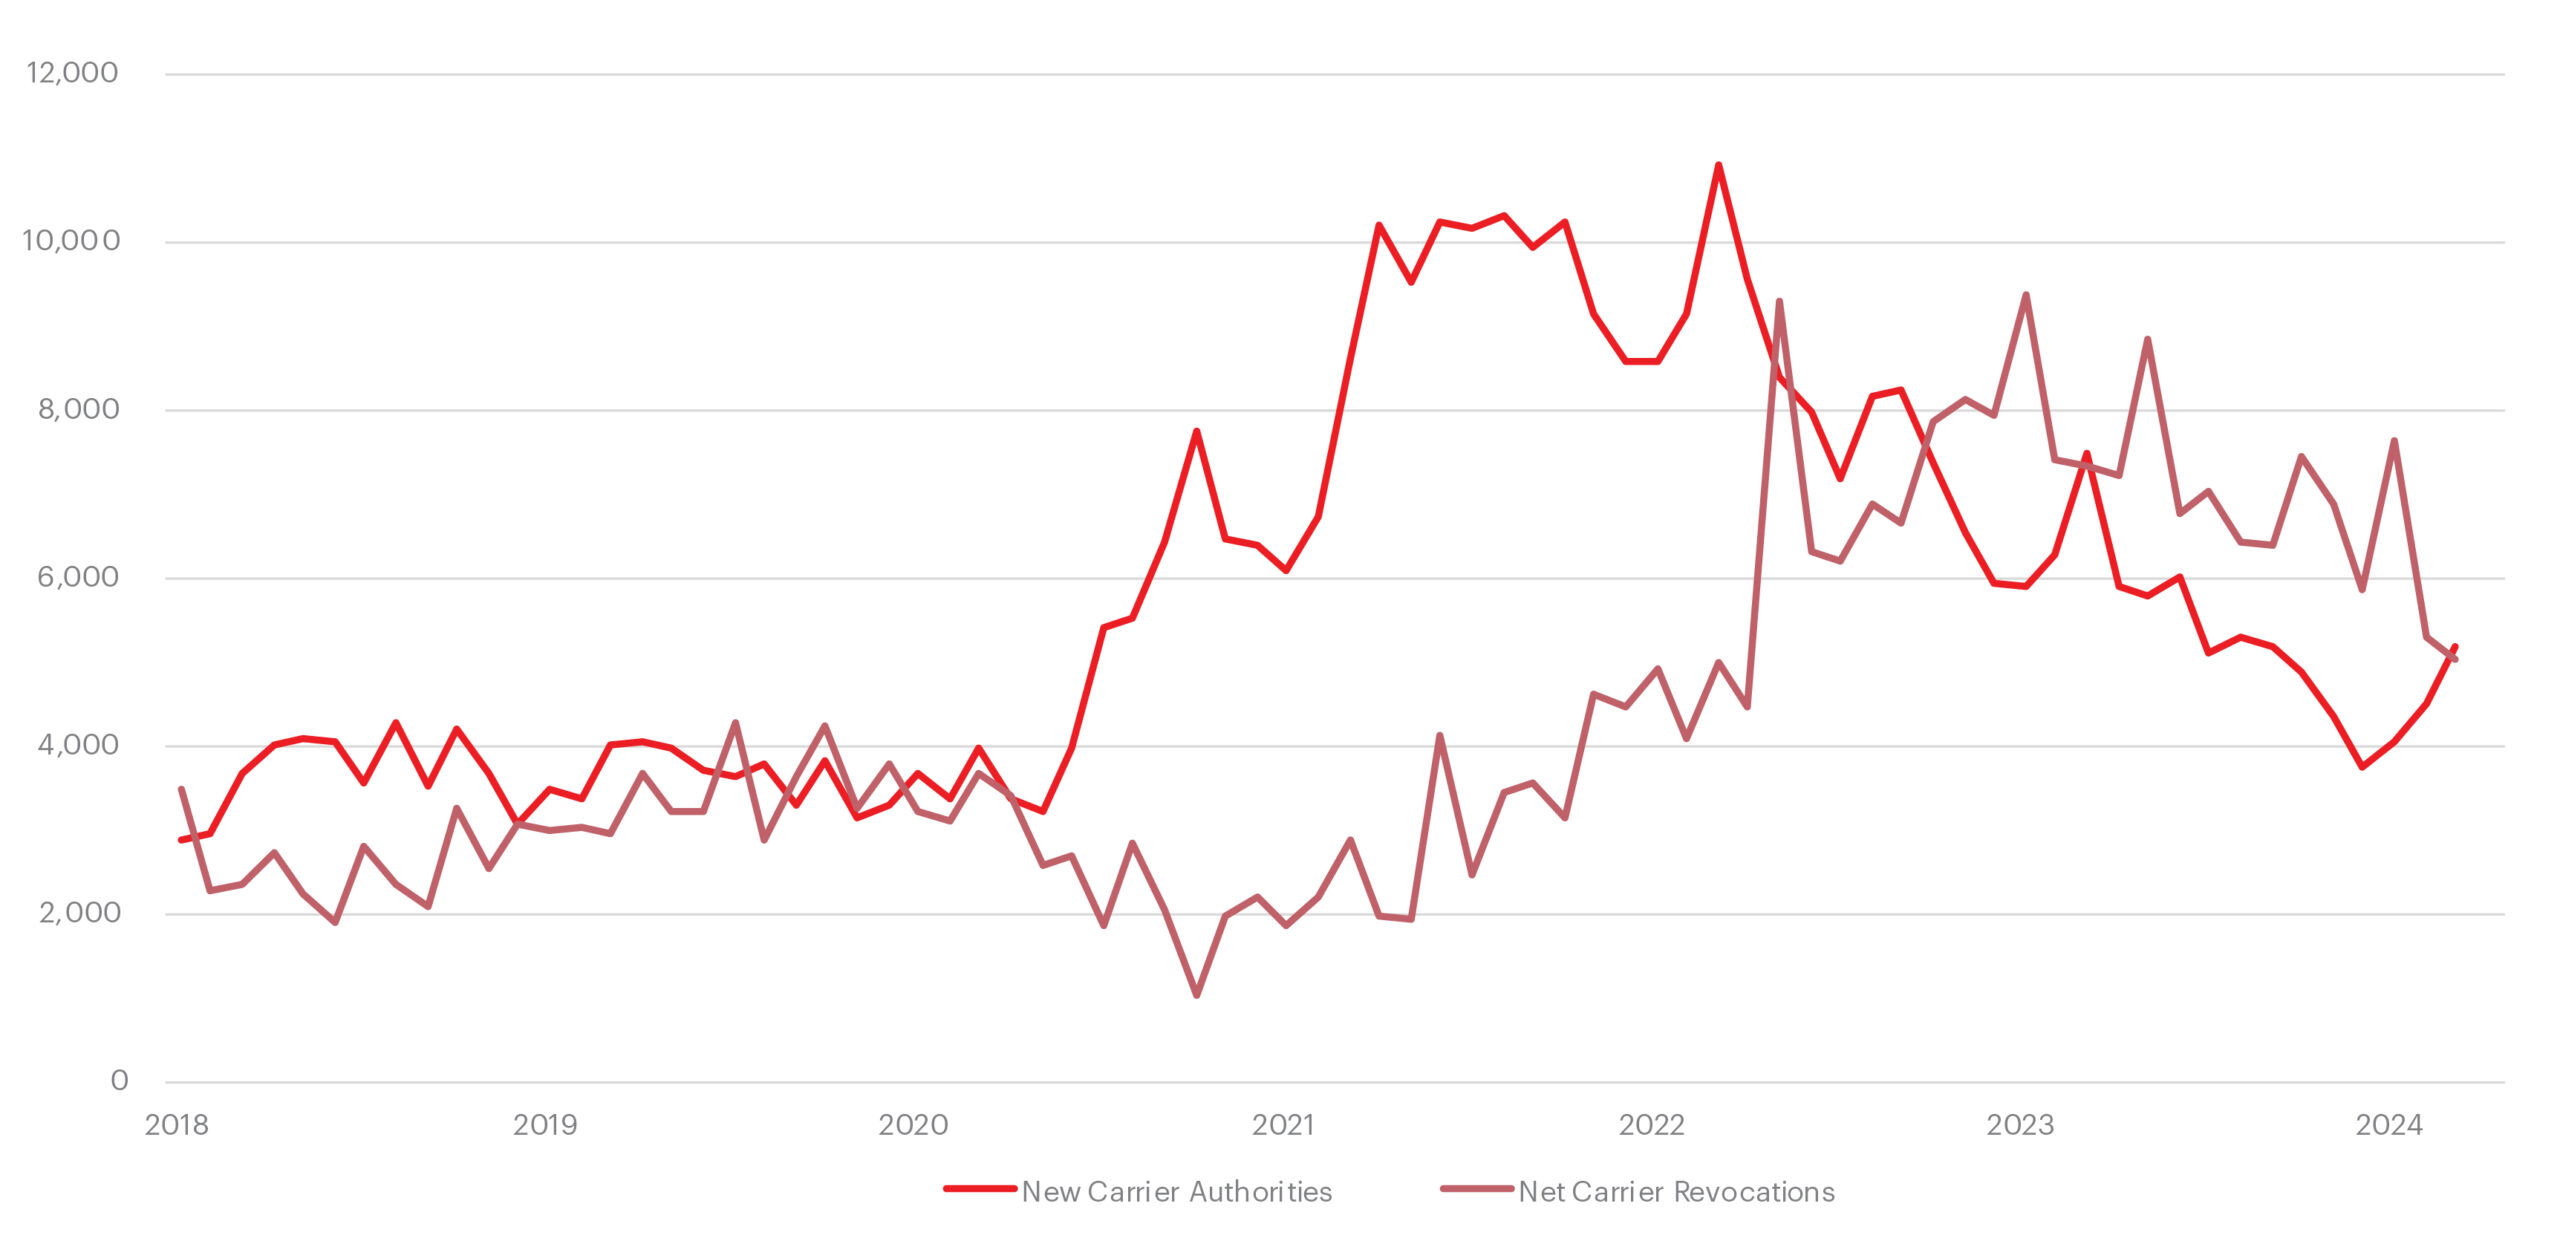
For six consecutive quarters, capacity reduction continues in this oversupplied capacity market. The first quarter of 2024 saw another net reduction of 4,241 carriers after a reduction of 7,204 in the last quarter of 2023. Trucking employment for for-hire carriers continued to stay negative at -1.7% on a YoY basis in Q1, indicating that excess capacity remained in the market longer than expected.
Source: Federal Motor Carrier Safety Administration (FMCSA)
More Info:
- Carrier revocations or exits continue to outpace new grants of authority for the sixth consecutive quarter, confirming the continued exit of capacity in an oversupplied market.
- Retail Sales for Class 8 TR Orders went negative (on a YoY basis) in Q4 2023 for the first time since Q1 2022 and continued to stay negative at -6.8% YoY in Q1 of 2024.
- Net Orders in Q1 dropped by 22.6% when compared against Q4 of 2023.
- Declining truck order lead time is a strong indicator of capacity exiting the market faster than capacity is willing to enter.
As we indicated last quarter, we have passed the bottom of the cycle; however, we find ourselves in an extended trough as the recovery is unfolding slower than anticipated with capacity lingering in the market. There seems to be growing skepticism among freight experts about the predictability of these cycles. However, this is not a departure from the norm, nor should it be seen as a “new normal” post-COVID. Why? The field- goal posts have simply shifted by a quarter, but the underlying dynamics of supply and demand remain unchanged. The market is rebalancing itself. That said, this part of the cycle is taking longer to flip when compared to what we saw in 2021/2022 or even in 2018.
TL Spot & Contract Curve (% YoY Change by Quarter)
What is the Beon™ Band?
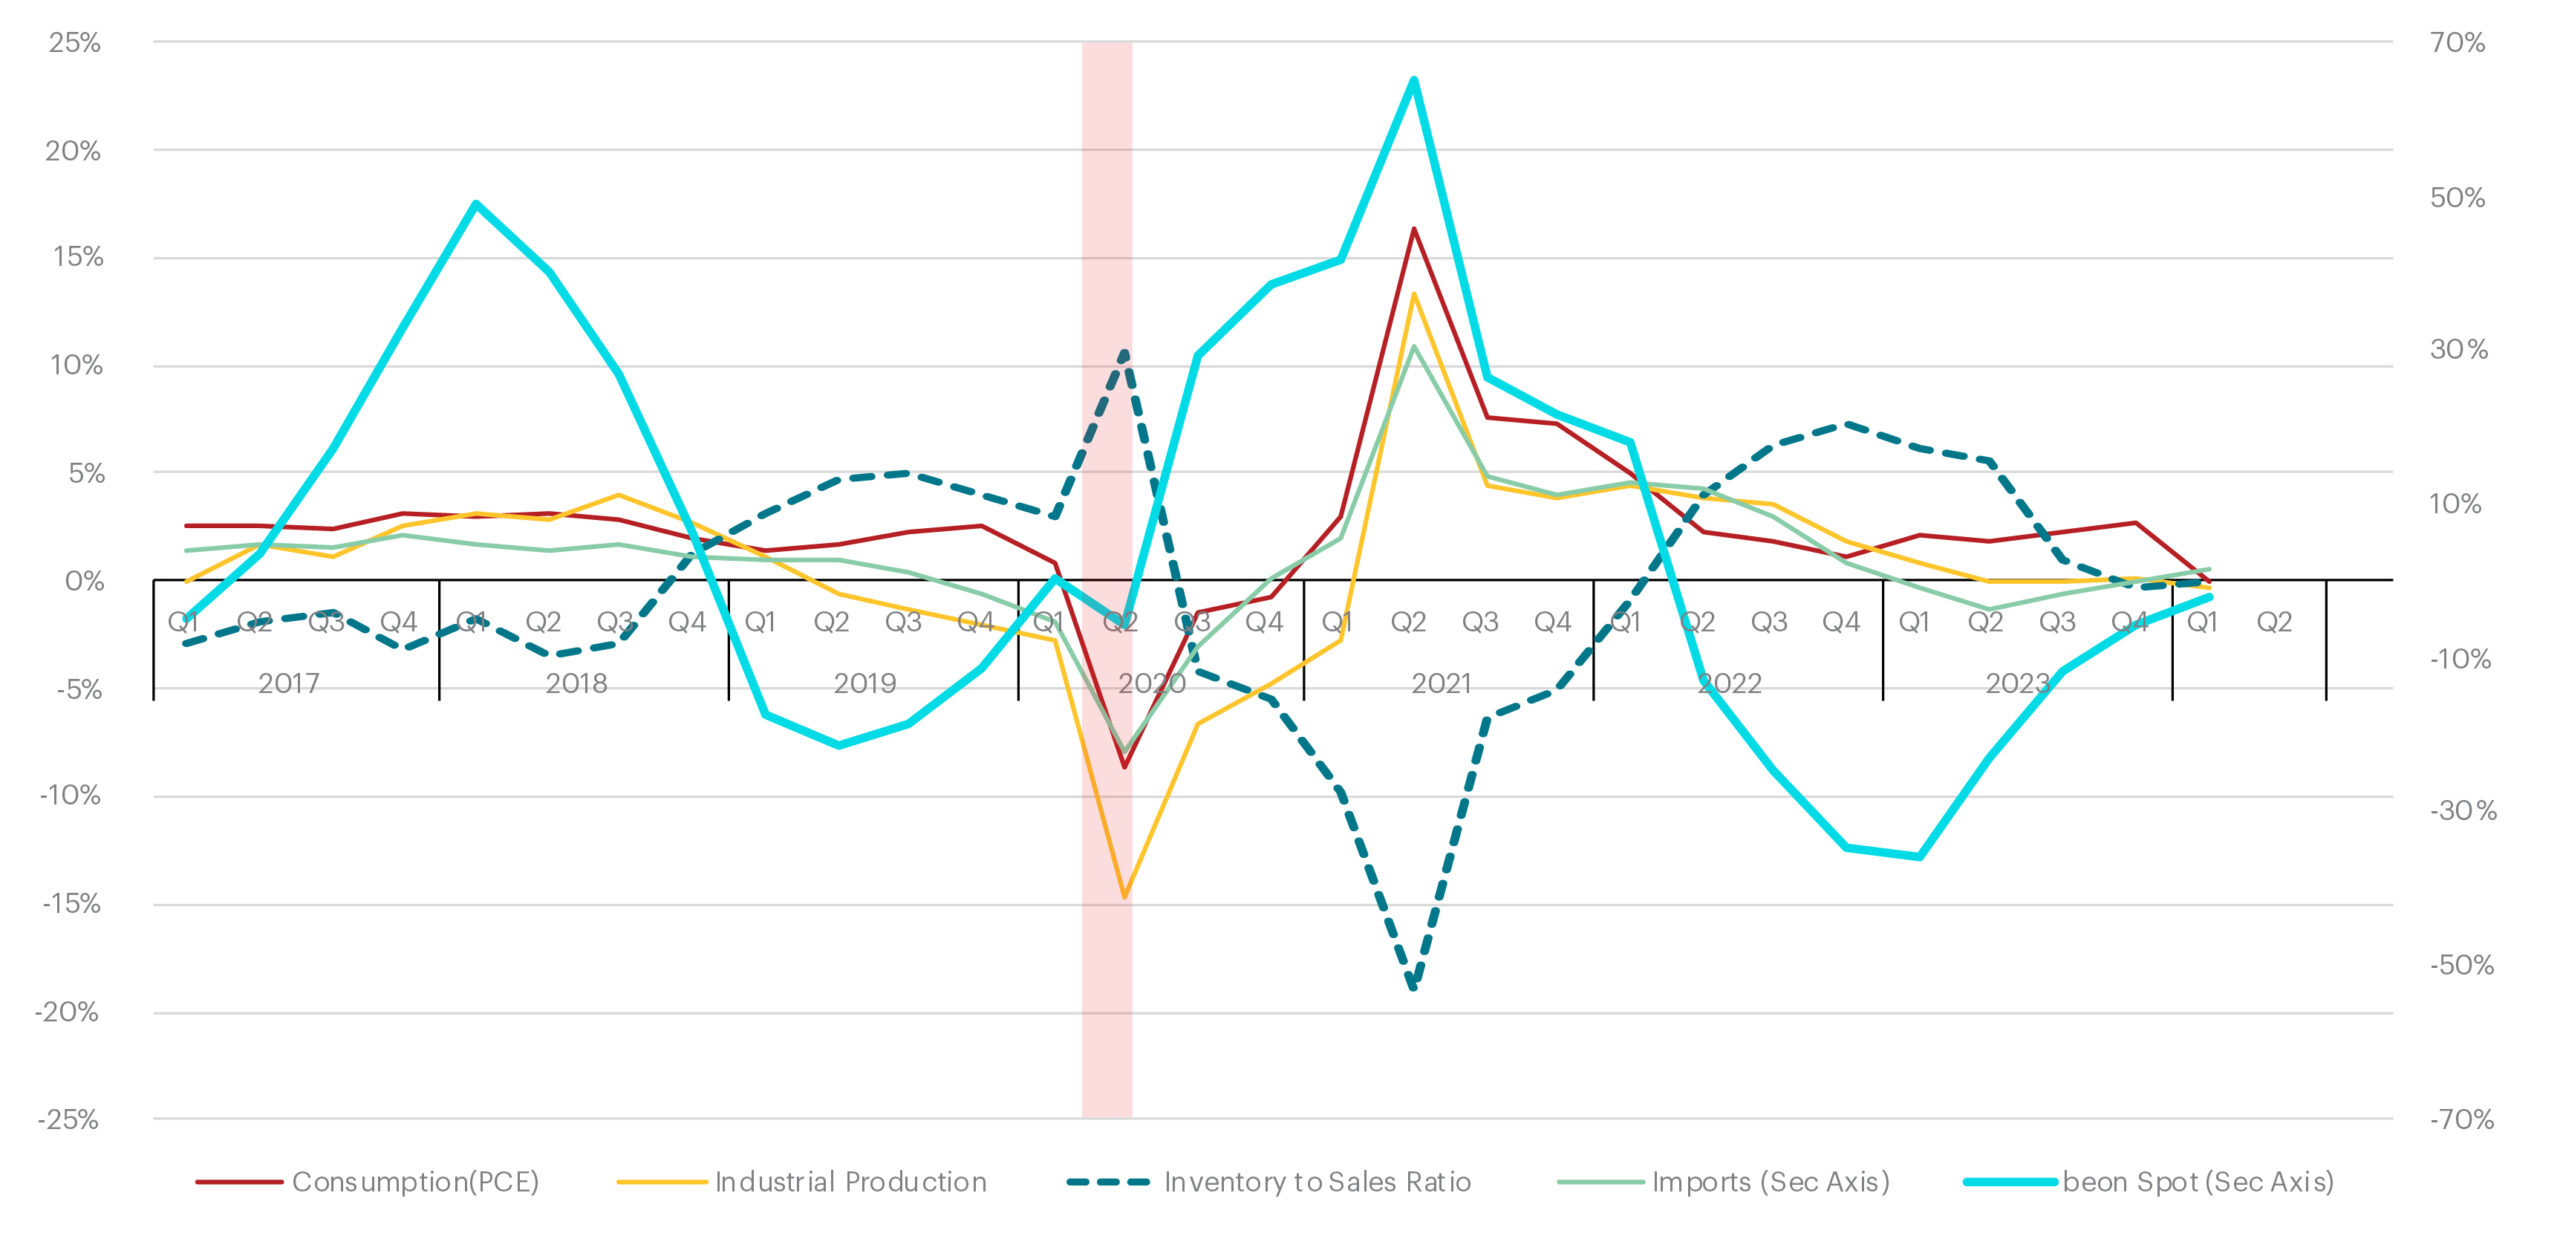
The Beon™ Band rolls up YoY quarterly averages of spot and contract freight data to create projections for future freight cycles. This Band is the outcome of the relationship between freight supply and freight demand, with freight demand being driven by the macroeconomic demand indicators. When we overlay the Beon™ Band with the demand curve in a single chart, we can see demand’s influence on the to-the-truck costs.
Source: Beon Band – Transportation Insight Holdings
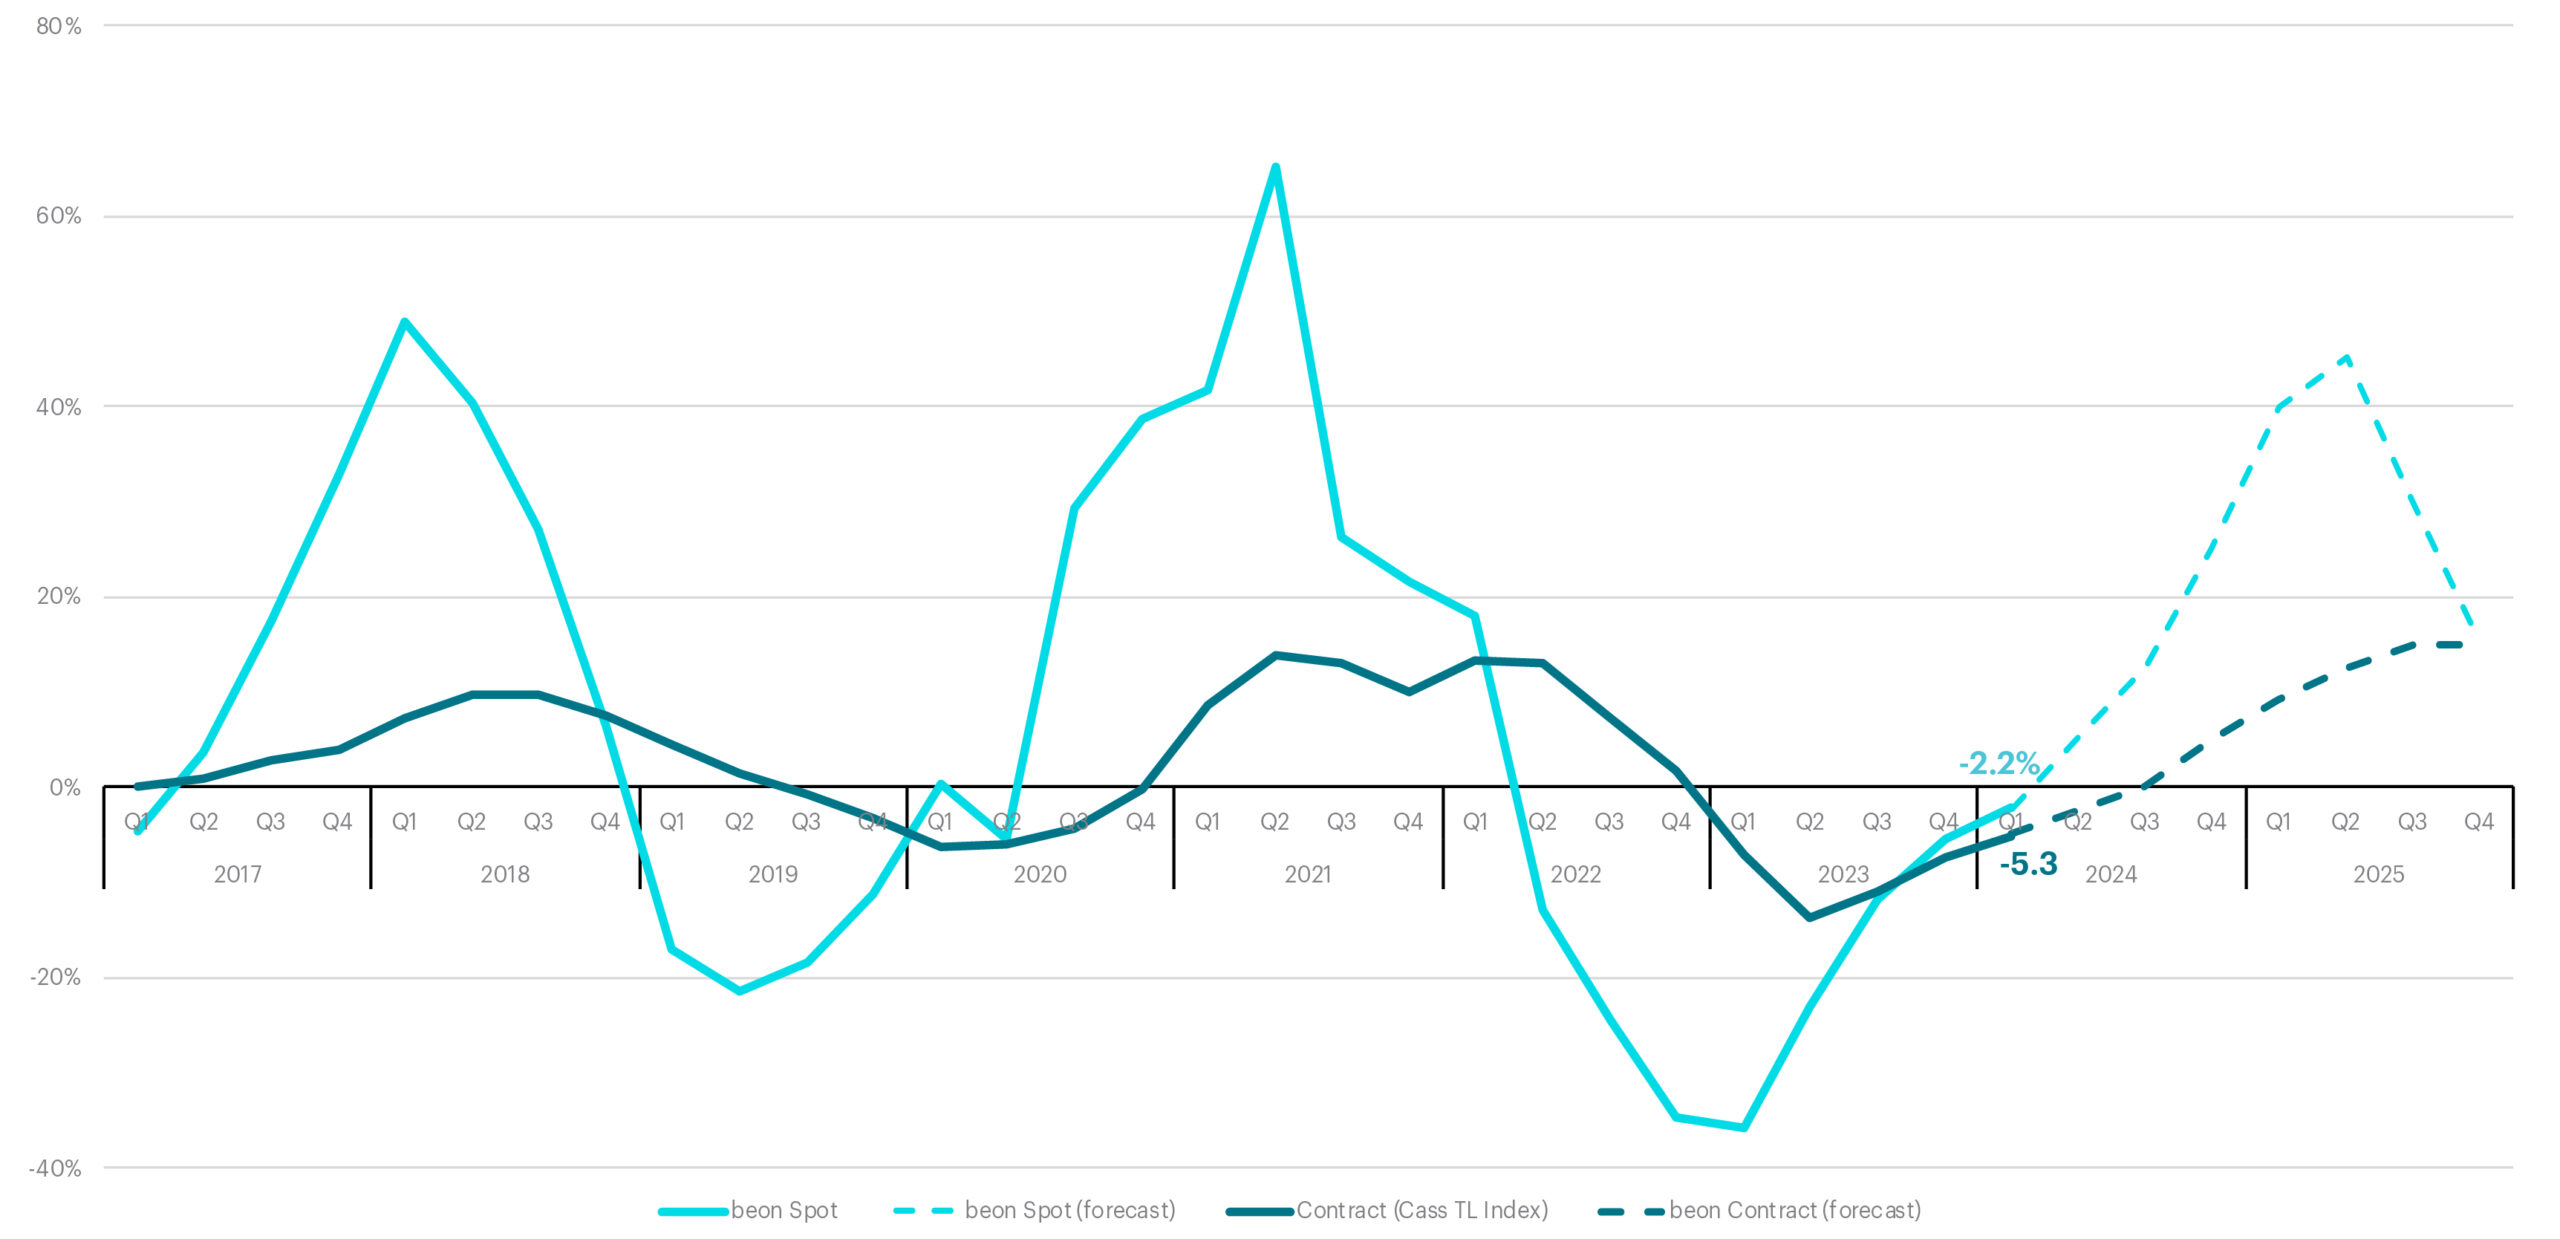
When the Beon™ Band is overlayed with the macroeconomic indicators of freight demand, we can understand how some of these factors impact freight rates and thereby forecast where we see the market going over the next couple of quarters.
Rate Forecast
Spot Freight
Spot rates went up in January due to inclement weather, but then saw a sharp decline in February and March due to continued softness in demand in an oversupplied capacity market. This protracted recovery period pushed the deflationary cycle to last another quarter. The Beon™ Band for Q1 ended at -2.2% against our forecast of +2.5%. However, with capacity continuing to exit and the manufacturing sector starting to expand, we are likely to see demand pick up in Q2 and thus expect the market to finally turn inflationary on a YoY basis within that quarter. We expect the Beon curve to continue to move up and reach its peak in the first half of 2025.
Contract
As expected, contract rates have gradually increased after bottoming out in Q2 of 2023. The first quarter of 2024 reported at -5.3% YoY, very close to our forecast of -5%. We expect the contract rates to climb up to -2.5% YoY in Q2 and turn inflationary in the second half of the year. It is important to note that the contract curve typically lags the spot curve by approximately two quarters.
Despite the headwinds of inflation and a drop in real income, amidst a tough monetary policy, the US consumer has shown resilience, and freight demand has started to show signs of growth. Additionally, the manufacturing sector expanded for the first time in the past 16 months and retail sales rebounded from the January drop. While the deflationary leg for the spot freight cycle was prolonged by another quarter in Q1, it has been directionally moving upward and is likely to cross the X-axis and enter YoY inflationary territory toward the end of Q2. Shippers have enjoyed the favorable buy-side for a bit longer than we originally anticipated, but it’s time to get ready for the next cycle.
Port to Porch Market Forecast
Drayage
Our projections from last quarter for the drayage landscape are manifesting as anticipated, with drayage volumes on the rise across the nation’s ports. This upward trend in volumes is expected to continue, with some anticipating an earlier-than-usual peak season. Imports from Asia also continue to rise, even as the industry grapples with global challenges like the ongoing crisis in the Red Sea, which surprisingly has not deterred shippers from finding workarounds.
In terms of specific port activities, Los Angeles, while still operationally fluid, is experiencing growing congestion, whereas ports in the southeast and along the Gulf face an upcoming challenge with looming labor negotiations. The ports of New York/New Jersey and Norfolk are seeing growth, spurred by the collapse of the Baltimore bridge, which is tentatively scheduled to reopen by the end of May or early June. Additionally, the Port of Portland has announced it will cease container services in October 2024 due to financial losses and the failure to secure a permanent third-party operator, which will further alter the Pacific Northwest shipping landscape.
On the administrative side, starting May 28, there will be a significant change in how per diem invoices are handled. These invoices will now be sent to shippers or forwarders instead of truckers, which could impact operational workflows.
Watch our webinar recorded on April 25 with Drew Herpich, Chief Commercial Officer, and Nathan Crocker, Senior Director of Drayage Operations, with Supply Chain Now.
Less-Than-Truckload
The Less-than-Truckload (LTL) sector is currently exhibiting surprising resilience despite broader perceptions of a “soft” market. This robustness can largely be attributed to the disciplined pricing strategies adopted by LTL carriers. The exit of Yellow last year has significantly influenced market dynamics, creating both challenges and opportunities within the sector.
Yellow’s departure from the market has alleviated some competitive pressure, enabling remaining LTL carriers to pursue price increases more aggressively. Historically, Yellow’s presence helped keep pricing competitive; however, with its exit, there is less downward pressure on rates. This shift has empowered incumbent carriers to target mid-single digit price increases confidently. However, it is crucial for these carriers to balance between maximizing profit margins and maintaining competitive service offerings to retain and grow their customer base.
The reshaping of the competitive landscape has opened substantial opportunities for non-incumbent carriers. These players are showing agility and eagerness to capitalize on gaps left by Yellow. Their strategy focuses on carefully evaluating which pieces of business align with their operational strengths and network capabilities, aiming to add profitable and manageable freight to their portfolios.
For both incumbent and non-incumbent carriers, the key to growth lies in selective freight acceptance — targeting the “right freight at the right price.” This approach entails a rigorous assessment of potential business, considering factors such as freight compatibility with existing operations, profitability potential, and long-term customer value. Carriers are increasingly using advanced analytics and technology to make informed decisions that align with their strategic goals.
Looking ahead, the LTL market outlook for the next quarter remains cautiously optimistic. As carriers navigate the post-Yellow landscape, the main challenges will revolve around maintaining pricing discipline in the face of evolving market conditions and customer expectations. LTL carriers must remain vigilant and adaptable to shifts in customer demand and broader economic indicators. Effective customer relationship management, innovative service solutions, and operational efficiencies will be paramount in securing sustainable growth and profitability in this sector.
Parcel
UPS Deep Dive: For the year 2024, UPS has reaffirmed its financial targets across various key metrics. The company anticipates consolidated revenue to be between approximately $92 billion and $94.5 billion, with a consolidated adjusted operating margin ranging from 10% to 10.6%. Specifically, by the end of 2024, UPS’s US Domestic segment is expected to achieve an adjusted operating margin of 10%. UPS projects its capital expenditures to be around 5% of its revenue, totaling approximately $4.5 billion. Furthermore, the company estimates its free cash flow to fall between approximately $5.9 billion and $6.7 billion, not accounting for any pension contributions.
In the second half of 2024, UPS expects a return to positive volume and revenue growth, a substantial reduction in the growth rate of labor costs following the first year of its new labor contract and realization of the majority of the $1 billion in savings from its “Fit to Serve” initiative. Additionally, revenue per piece is expected to outpace cost per piece. UPS also reaffirms its three-year consolidated financial targets, aiming for revenue between $100 billion and $114 billion by 2026, with the higher end of projections including growth from healthcare and international markets. The adjusted operating margin is anticipated to exceed 13%, including at least a 12% adjusted operating margin from US Domestic operations.
Trade Enforcement: The US is set to intensify scrutiny on an import method popular among e-commerce giants like Temu and Shein, which allows cheap clothing from China to enter the US without duties and minimal oversight. This method, known as de minimis shipments, involves parcels valued at less than $800 sent directly to US consumers. The Department of Homeland Security announced that these shipments would now face more stringent checks, including laboratory testing and targeted enforcement operations to ensure compliance with US laws, including the forced-labor ban.
This decision follows calls from US industry groups, unions and bipartisan lawmakers to close what has been criticized as a loophole that effectively offers China a free-trade agreement. In 2023 alone, around 1 billion parcel packages, many from China with Temu and Shein accounting for nearly a third, entered the US. The current administration’s push for stricter regulation is also portrayed as an effort to protect the jobs of approximately 500,000 US textile workers.
Actions for Shippers: With parcel providers attempting to gain any capacity they can, it is now a very advantageous time to try and renegotiate contracts with your carriers. Whether a $2M shipper or a $100M shipper, there are meaningful cost savings that are occurring within the market right now. It is also critical to understand how things like fuel surcharge changes will impact how you choose providers to use especially when considering several changes to fuel tables this year alone.
In one of the most competitive markets in decades, shippers are advised to capitalize on favorable conditions by renegotiating contracts and exploring more cost-effective shipping options, even if it involves incurring penalties stipulated by existing penalty language, as the potential benefits could outweigh these costs. Additionally, shippers should review their surcharge discounts and assess the impact of fuel cost models on their budgets. By scrutinizing these aspects, shippers can better manage overall shipping costs and take full advantage of a market that presents more opportunities for cost savings and improved terms than has been seen in decades.
Watch our webinar recorded on April 10 with Robyn Meyer, SVP of Parcel Strategy & Solutions, on the State of the Parcel Market with Supply Chain Now.
Leadership Talking Points
In this Outlook, we have covered important events to monitor this quarter and throughout the year, analyzed current macroeconomic demand indicators and freight supply metrics. We have also provided our projections for truckload spot and contract rates, as well as our port-to-porch forecast. With this information in hand, here is how you can address some of the questions your executive team may have about what to anticipate in 2024:
- What is the current state of freight? The transportation market is entrenched in a protracted period of recovery. Rates are stubbornly low and remain in the shipper’s favor. However, this won’t last all of Q2. We expect CVSA International Roadcheck Week to push rates higher, followed by Memorial Day and end of month activities. By the end of Q2, we expect to be in inflationary territory. We’ve also shifted the peak of the next inflationary leg by one quarter into 2025.
- What does this mean for shippers? Gradually, as with previous freight cycles, enough capacity and brokers will leave the industry to achieve a balance between supply and demand. Once sufficient capacity reduction has taken place, carriers will start to challenge shippers’ rates, leading to renegotiations. Additionally, many carriers may choose to abandon their contractual obligations in favor of pursuing higher rates on the spot market. This shift will disrupt routing guides and increase the cost of shipping freight.
- Reminder: The freight market is like a faucet, not a light switch. Market transitions don’t happen instantly, but rather slowly, like the faucet slowly turning on. This is currently happening with stronger demand indicators and reduced capacity, signaling the shift into the next cycle. As carriers continue to exit the market, freight demand will rise, leading to significant changes. It’s important to note that during market changes, it’s not a sudden switch, but a gradual opening of the faucet.
- Okay, so what do I do now? Here are some comprehensive and actionable insights you can take to your leadership team to help shape the coming quarters in the transportation market:
- Strategic Carrier Management in Upcoming Bids: As you approach the bidding process for the next cycle, it’s crucial to strategically manage carrier relationships. Reward carriers that have consistently met their commitments by continuing partnerships with them into the second half of 2024 and into 2025. The aim is to have a reliable roster of carriers as the spot market begins to heat up, ensuring stability and reliability in your transportation network. Short term pretenders will give you paper rates to win business whereas long term partners might charge you a bit more, but will deliver better quality service and reliability.
- Lane Density and Efficiency: Consider bundling small volume lanes that are geographically or operationally similar to create lane density. For example, consolidating shipments from one region to another or from similar three-digit ZIP code areas can lead to more efficient routing and cost savings. Less risk on core-corridors;
- Leveraging the lanes with key volume that won’t have as much change to rates “desirable lanes”
- Communication and Transparency with Carriers: Clearly communicate your expectations and definitions of success to your carriers. Establishing open lines of communication enhances partnership quality as carriers become more aligned with your strategic goals. This mutual understanding is vital for turning carriers into value-adding partners who actively contribute to your success.
- Preparation for Changes in Tender Acceptance: While tender acceptance rates are currently high, it is prudent to prepare for this to decline in the coming months by developing your routing guides to have reliable secondary and backup carriers. This preparation ensures continuity and service quality even when primary carriers fail to meet tender expectations. Start looking now at carriers/brokers making small percentage changes to acceptance rates. Slight changes now such as a 1-2 percent adjustment might indicate that more are to come.
- Optimization of Carrier Routes: Work toward creating more predictable and efficient lanes for your carriers. Predictability allows carriers to plan better, potentially reducing costs and improving service levels. This strategy not only benefits your operations but also enhances carrier operations, creating a win-win scenario.
- Comprehensive Cost Evaluation: When assessing carrier performance and cost-efficiency, look beyond just linehaul costs. Consider the broader impact of operational disruptions, such as penalties for late deliveries and additional costs incurred from emergency use of the spot market due to carriers failing to meet commitments. A holistic view of costs will provide a more accurate measure of carrier performance and how it impacts your operations.
- Market Timing and Strategic Planning: Avoid attempting to time the market. Instead, use the insights and data analytics provided to set realistic expectations with your leadership and finance teams, especially as you approach budget planning season for 2025.
.This proactive approach aids in strategic planning and helps mitigate risks associated with market volatility. - Leverage Analytical Partnerships: Utilize partnerships with transportation and logistics providers like TI and NTG to conduct detailed analyses of your transportation needs. These partners can offer valuable insights and support in optimizing your transportation strategies, thereby enhancing overall operational efficiency.
Thank you for reading our Q2 2024 Transportation Outlook. If you have any questions or comments, contact us.
Recent Posts

Beon Rewards FAQs


